Population map: dasymetric disaggregation
- The text on this page is taken from an equivalent page of the IEHIAS-project.


Four different modelling strategies were applied to estimate population, reflecting different aggregations of the original land cover classes. Strategy 1 was the most detailed, with strategy 4 being the most simplified.
All the modelling strategies performed relatively well at both national and EU level, with R2 between modelled and actual population at NUTS 5 (~ LAU-2) level generally between 0.8 and 0.9, and SEE in the range of 2–5000 people. Differences between strategies were slight, with overall performance decreasing slightly as the models were simplified. To minimise the effect of step changes at country borders, the EU models were preferred for European mapping.
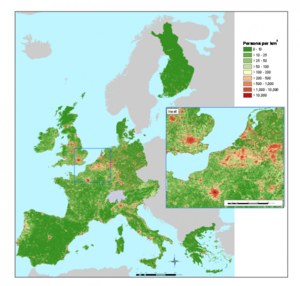
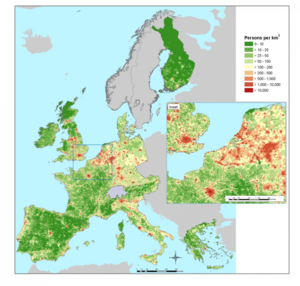
A map for the EU strategy 1 model (R2 of 0.82; SEE of 4518 people) in Figure 1 is contrasted with a population density map based on the NUTS 5 census data (Figure 2). The weights for the EU strategy 1 model are given in Table 1 below.
| Land Cover Class | Lit area | Unlit Area | Unlit Area |
|---|---|---|---|
| 1: Continuous urban | 187.0 | 142.3 | 0.023 |
| 2: Discontinuous urban | 98.9 | 85.4 | 0.007 |
| 3: Industrial / commercial | 141.2 | 95.7 | |
| 4-6: Transport | 54.0 | ||
| 7-9: Waste, extraction and construction sites | 13.3 | 0.009 | |
| 10: Institutions | 128.1 | 0.023 | |
| 11: Urban green space | 62.6 | 19.7 | |
| 12-17,19: Arable and permanent crops | 0.4 | 0.2 | 0.005 |
| 18: Pasture | 1.6 | 0.6 | |
| 20: Complex cultivation patterns | 1.0 | 0.013 | |
| 21: Land principally occupied by agriculture | 0.017 | ||
| 22,24,25: Other woodland | 0.0 | ||
| 23: Broad-leaved woodland | 8.8 | 0.2 | 0.005 |
| 26-29: Unimproved grass and scrub | 0.009 | ||
| 30-38: Other uncultivated | 0.4 | ||
| 49: Unclassified surfaces | 19.1 | 1.0 |