IEHIAS causal chain
- The text on this page is taken from an equivalent page of the IEHIAS-project.
The concept of the causal chain is fundamental to integrated environmental health impact assessment, and one of its defining principles. All issues assessed by IEHIA need to be seen and represented as a causal chain.
One reason for this is that the way in which we define any issue, and the way in which it is assessed, depends on our view of the way the world is structured and works. This is not always made explicit: we have a natural tendency to take it for granted and assume that everyone else shares our worldview. In practice, they do not, so it is important to make absolutely clear what this underlying view of reality is. In the case of environmental health, we are concerned primarily with the relationships between environment (as a source of exposure to hazards or access to resources) and human health. These relationships comprise a set of causes and effects – and typically involve many of each (i.e. many-to-many relationships). They are best represented, therefore, in the form of a causal chain or web (also known as the ‘full impact chain’), showing the links between sources and impacts, via a series of steps.
This is not to suggest that there is only one way of depicting causal relationships. Causal chains can be constructed in many ways of doing this. The best formulation will depend on the type of issue being considered, as well as the needs of the users involved. The diagram below shows a simple causal chain for pollution-based hazards. This may need to be adapted for other sorts of hazard (e.g. natural hazards) or for environmental benefits (e.g. green space). Whatever ther issue, this simple diagram will also need to be expanded and/or customised to capture more fully the details that need to be addressed (see links to left).
Expanding the causal chain
The simple causal chain summarising the links between sources and health impacts tells only a small part of the full story. In practice, each of these links represents a set of processes, acting upon a set of factors or variables. These processes are influenced by policy interventions, as well as other (e.g. environmental, economic or technological developments). The whole causal chain thus operates within a wider context.
Customising the causal chain
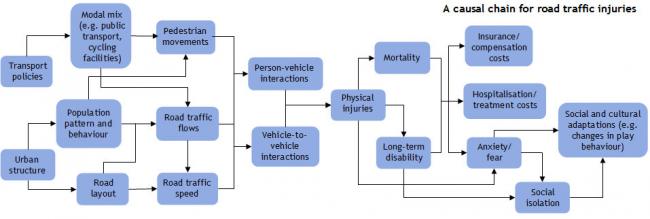
No representation of the causal chain is likely to be applicable to every circumstance. Whilst one version of the chain may work for environmental contaminants (e.g. air or water pollution), others may be necessary to represent issues such as health impacts of natural hazards, insect-borne diseases or traffic accidents. In most cases, also, we will need to add detail to the chain to show the specific elements that are of interest. The example below shows a causal chain for road traffic injuries. Some elements of the basic (pollution-based) chain are evident: road traffic flows, for example, are akin to environmental concentrations, vehicle-to-vehicle and person-vehicle interactions might be thought of as a form of exposure, and injuries clearly represent health effects. However, neither sources nor releases are so clearly identifiable.
We therefore have to be willing to customise the causal chain to the issue being assessed. In the process, we will often find that the original, simple linear structure becomes less apparent, and the chain becomes more web-like in structure. This should not be a cause for concern: the causal chain is only a ‘model’ and should be adjusted to match our perception of reality, not the other way round!


