Energy crop scenarios
- The text on this page is taken from an equivalent page of the IEHIAS-project.
Scope: To obtain estimates/projections of energy crop type and distribution in the regions of interest (Thessaly and Central Macedonia) according to the business-as-usual and mitigation scenarios.
A. Mitigation scenario
This scenario, for 2020, 2030 and 2050, is based on a recent EEA study (see references below).
Extrapolation to the year 2050 was done by fitting the trend for the entire EU-27 to data for the study regions. Most of the land allocated to energy crop cultivation is assumed to be released arable land and to a lesser extent set-aside land.
| AT | BE | CZ | DK | EE | FI | FR | DE | EL | HU | IE | IT | LV | LT | NL | PL | PT | SK | SI | ES | SE | UK | EU-14 | New member states (EU-8) | EU-22 | |
|---|---|---|---|---|---|---|---|---|---|---|---|---|---|---|---|---|---|---|---|---|---|---|---|---|---|
| 2010 | 204 | 0 | 303 | 74 | 88 | 486 | 536 | 100 | 356 | 413 | 0 | 1074 | 83 | 523 | 0 | 3823 | 250 | 81 | 3 | 2706 | 135 | 824 | 5320 | 7646 | 12965 |
| 2020 | 266 | 0 | 314 | 0 | 154 | 299 | 1000 | 2000 | 298 | 512 | 0 | 1786 | 144 | 882 | 0 | 4321 | 169 | 140 | 16 | 2582 | 168 | 1118 | 6181 | 9686 | 16170 |
| 2030 | 290 | 0 | 301 | 0 | 159 | 174 | 2000 | 3000 | 266 | 547 | 0 | 2165 | 183 | 1055 | 0 | 4525 | 125 | 213 | 36 | 2459 | 178 | 1584 | 7019 | 12249 | 19267 |
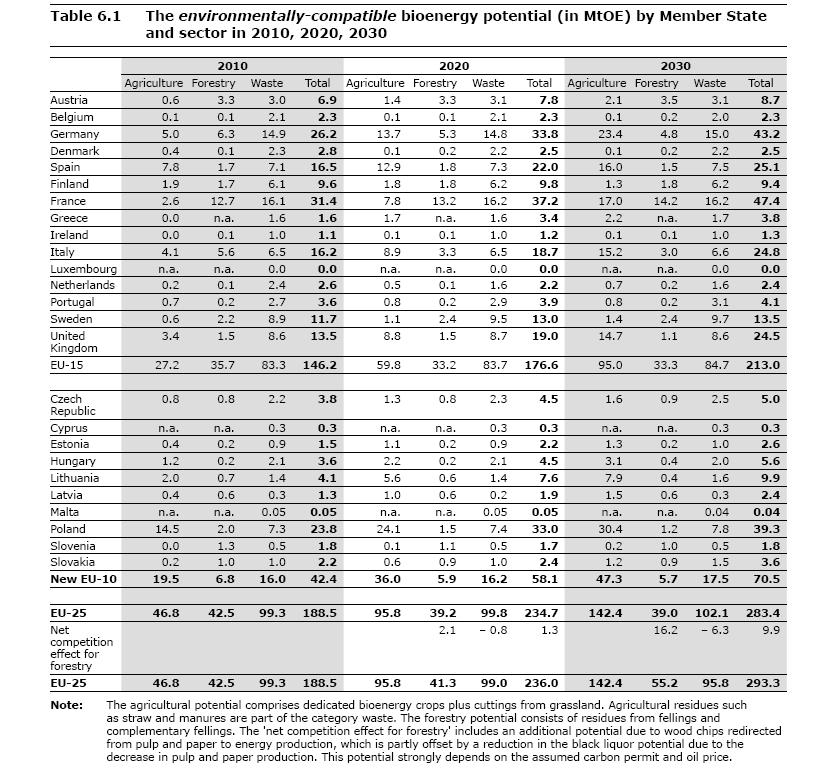
The results of the EEA study are summarized in the attached file from the EEA report. The following points should be noted:
- The substantial increase of bio-energy production is apparently due to crop cultivation. The data for 2020 and 2030, and extrapolated to year 2050, constitute the part of the mitigation scenario referring to energy crops.
- It is foreseen that forestry makes a small contribution to energy production in the context of the mitigation scenario; this prediction is in accordance with other stakeholders' opinions (e.g. Europa Bio 2007).
- For the purpose of the case study, the EEA projections of land allocation to energy crops (Table 3.2, reproduced above) are employed. In estimating equivalent energy production under the scenarios, account has to be taken of:
- agricultural residues related to the crops, in addition to the main product (seeds or grain); and
- an appropriate yield for both main crop (seed and grain) and the remainder of biomass (from the plant, where applicable) - i.e. the total biomass produced per unit area cultivated.
- The estimates of equivalent energy (MToe or eJ per year) derived for these scenarios differ from those indicated in Table 6.1 (attached below) in that :1
- more detailed yield values are employed; and
- both main crop/product (grain, seed) and plant biomass is considered in the yield estimates.
B. Business-as-usual (BAU) scenario

The rate of increase of biomass production in EU-27 before year 2003 was approximately 1.25 Mtoe/yr, as shown in Figure 1, below. In 2003, a reform to the CAP established subsidies for energy crops cultivated in EU-27 up to a total area of 2.0 Mha. The above rate of increase is attributed largely to the general trend of increasing yield of the various crops and possibly to increased utilisation of agricultural residues. Only part of that increase is considered to be due to explicit land reallocation to energy crops. For the purpose of selecting a BAU scenario, an average yield of of 10t TS/ha is assumed for energy crop. This is based on the observation that approximately 50% of the increase in biomass production seen in recent years (~1.25 Mtoe/year) is due to land allocation to such crops.
C. Total land requirements for the energy crops
To estimate land requirements for energy crops in the two Greek case study areas (Thessaly and Central Macedonia), the national data are scaled down proportional to the area of total arable land. Table below shows the resulting projections for the different scenarios and years.
| Scenario | Total (all energy crops) | Sunflower | Sorghum | Cardoon |
|---|---|---|---|---|
| Baseline | - | - | - | - |
| BAU 2020 | 581 | 194 | 194 | 194 |
| Mitigation 2020 | 1104 | 368 | 368 | 368 |
| BAU 2050 | 329 | 110 | 110 | 110 |
| Mitigation 2050 | 413 | 138 | 138 | 138 |
References
- EEA 2006 How much bioenergy can Europe produce without harming the environment? EEA Report No 7/2006. Copenhagen: European Environment Agency.
- Doran, M. 2008 Contribution of energy crops in displacing fossil fuels in the EU. Paper presented at Integrating Generations, FIG Working week 2008, Stockholm, Sweden, 14-19 June 2008.
- Nielsen, J.B.H. and Olekskowicz, P. 2008 The future of biogas in Europe: visions and targets until 2020. Paper presented at AEBIOM Workshop: Biogas - promising renewable energy source for Europe, European Parliament Brussels, December 11, 2008.
- EuropaBio 2007 Biofuels in Europe. European Association for Bioindustries, Position paper, June 2007.
- Eurostat 2008 Eurostat pocket-books 2008. Luxembourg: Office for Official Publications of the European Communities.
