Focal sum modelling in IEHIAS
- The text on this page is taken from an equivalent page of the IEHIAS-project.
The Focalsum Model is a GIS-based model designed to estimate environmental concentrations of pollution from local source emissions. It is based on the principle that proximity to the source (e.g. roads or industry) is one of the main determinants of pollutant concentrations. Although developed primarily for air pollution, it can be adapted to a range of other types of pollution, such as noise or non-ionising radiation.
Further details about the Focalsum Model and a downloadable ArcGIS tool are provided below. Click here for an example of how the model can be applied to estimate pesticides, PM, and endotoxins from agricultural sources.
Model description
Purpose

The Focalsum Model is a downloadable GIS tool that can be used to estimate environmental concentrations of pollution from local source emissions.
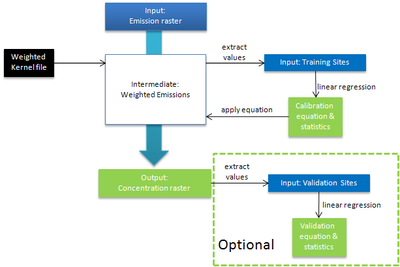
It uses the ArcGIS focalsum function with a weighted kernel to simulate the distance decay from sources. The weighted emissions are then calibrated with monitored pollution data, using linear regression, to produce a concentration surface. An optional validation step, using a reserved set of independent monitoring, is also included.
In the Focalsum model the size, basic shape (square, circle) and weights (1/d, 1/d2 where d = distance) for the kernel file can be specified by the user. Users may also wish to apply existing kernel files either manually created or derived, for example, from dispersion models.
Boundaries
Field of model: Ambient pollutant concentrations, averaged over periods of months to years.
Spatial resolution: raster (metres to kms)
Pollutants: Any locally derived, relatively non-reactive pollutant species
Source types: Local low-level emissions from point, line or area sources (e.g. road traffic, housing, agriculture, industry). The methodology does not work well with high-level emission sources which are likely to disperse over large distances (e.g. major combustion plants).
Input
Two main data inputs are required:
- monitored pollution concentrations at a sample of sites (point shape file). One shape file is required for the training set. To include model validation, an optional second shape file containing an independent subset of sites is required. Both the training and validation shape files require a unique ID of ‘long’ integer type (i.e. in addition to the default FID).
- emissions, or a proxy for them (e.g. source intensity), to provide measures of source intensity (raster).
Data format: ESRI’s ArcGIS shape file and raster.
Output
Output: concentrations for a single raster of the same resolution as the input emissions, and in the same measurement units as the concentration data.
Data type: area estimate
Data format: ESRI’s ArcGIS raster
Description of processes modelled and of technical details
Software requirements:
- Operating system: Windows
- ArcGIS9.3 + Spatial Analyst Extension
Typical run time:
< 5 minutes
Adaptability:
- Programming language: VBA
- Open code which can be modified and adapted by user
Level of expertise required:
Basic
Cost:
Free for use
Developers:
Kayoung Lee, Danielle Vienneau, Kees de Hoogh and David Briggs (Imperial College London)
Owned by:
Imperial College London
Rationale
Focal functions are applied to raster data, and compute an output raster where the cell value at each location (target cell) is some function of the input cells in a specified window (defined by the kernel file) around the location. In the Focalsum model, the window is moved across an input emissions raster to collect (i.e. sum) the source contributions and assign them to the target cell. With a weighted kernel one can assign greater contributions from specific sources. Nearby sources, for example, may be more heavily weighted to reflect their more direct contribution; sources directly upwind of the target cell may also be more heavily weighted to reflect the effects of wind direction.
The model provided here allows GIS users quickly to model ambient pollution concentrations, as a proxy for exposure, by directly using source emissions data. Monitored data are used to calibrate and optionally validate the resulting concentration surface.
Click the attachment links below to download the Focal Sum Tool and User Guide.