Geographical Model of Radio-Frequency Power Density
- The text on this page is taken from an equivalent page of the IEHIAS-project.
GEOMORF is a GIS-based model, designed to simulate power density around EMF transmitters such as mobile phone masts.
Model description
Purpose

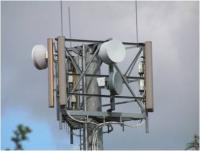
The Geographical Model of Radio-Frequency Power Density (Goemorf) is a GIS–based exposure model designed to estimate power densities at receptor locations around mobile phone base stations. The model uses a semi-Gaussian formulation to represent spatial variations in power densities around mobile phone masts, on the basis of power output, antenna height, tilt and the surrounding propagation environment.
Boundaries
Outdoor exposure
Spatial resolution: address or postcode
Input
| Mx,My | Mast location | metres | x and y co-ordinates of the source mast |
| Rx,Ry | Receptor location | metres | x and y co-ordinates of the receptor |
| Em | Elevation of mast | metres | Height of the ground surface above ordnance datum, at the mast location |
| Er | Elevation of receptor | metres | Height of the ground surface above ordnance datum at the receptor location |
| Ha | Antenna height | metres | Height of the centre point of the antenna, above the ground surface. Default = surface height + 20 metres. |
| Hr | Receptor height | Metres | Height of the midpoint of the receptor, above the ground surface. |
| Tt | Net tilt | degrees | Total tilt due to electrical and mechanical tilt. Default = 6.5o |
| P | Power output | W | Maximum operational effective isotropic radiated power output of the source antenna |
| Zb | Azimuth | degrees | Direction (degrees from true north) of the centreline of the mainbeam of the antenna |
| BWd | Vertical beam width | degrees | Specified vertical beam width of the source antenna Default = 6o. |
| BWl | Horizontal beam width | degrees | Specified horizontal beam width of the source antenna. Default = 67o. |
| Tlos | Topographic line of site | Topographic line of site from antenna to receptor (0,1); modelled using visibility function in GIS. | |
| C | Land cover type | Categorisation of land cover in area surrounding the receptor (urban, forested, open); determined by intersecting land cover data with receptor locations in GIS. |
Output
Output: Power density (mW/m2)
Data type: point estimate(s)
Data sources: mobile phone operators
Data format: ESRI ArcGIS shape files
Description of processes modelled and of technical details
- Operating System: WINDOWS
- Software requirements: ArcGIS9.3 + Spatial Analyst extension
- Programming language: VBA
- Developed by Imperial College London
- Model is free to use
- Intellectual property rights Imperial College London
- Canned model - cannot be modified
Rationale
THe GEOMORF model is based on the free-space equation for electromagnetic radiation, adapted to take account of the reduction in power density both along the beam and transverse to the beam. The model has been developed and validated on the basis of field measurements made around a series of mobile phone transmission masts (macrocells) in Great Britain, where it was shown to give good approximation of measured power densities (r2 ~0.6) across a wide range of conditions. In densely built-up urban areas, performance is poorer, due to local variations caused by buildings.
See also
- Geomorf model: link to download ArcMap document
- Geomorf User Guide: link to word document
- Geomorf parameters guidance: link to spreadsheet