Dispersion modelling: transport
- The text on this page is taken from an equivalent page of the IEHIAS-project.
As part of the EU-funded INTARESE project, which contributed to the development of this Toolbox, case studies were carried out to assess health impacts of different road transport policies in different cities in Europe (The Hague, Helsinki, London, Barcelona, Rome).

In London, the assessment focused on the effects of the introduction of the Low Emission Zone (LEZ).
The LEZ was started on 4 February 2008 and covers and the Greater London area (within the M25). It is aimed at older, diesel-engine lorries, buses, coaches, large vans and minibuses, which are required to meet certain emissions standards: the EURO III standard for particulates from 2010 and the EURO IV standard from 2012.
To assess the health impacts of this policy, outdoor concentrations of NO2 and PM10 were modelled for the year 2010, under scenarios both with and without the LEZ. Modelling was done with the ADMS-Urban model - a semi-Gaussian Lagrangian model, which is defined as the standard for air quality management purposes by local authorities in the UK.
The model requires data on both the road network and associated traffic flows. These data were extracted from the London Atmospheric Emission Inventory (LEAI, 2003). Emission factors also have to be defined. This was done by projecting emission factors from 2001 forward to 2010: for the scenario ‘without LEZ’ these were used without adjustment; for the ‘with LEZ’ scenario, the factors were adjusted to reflect the achievement of EURO III or higher standards for targeted vehicles. The EMIT software was then used to apply these emission factors in order to convert the LEAI road traffic data into emission rates.
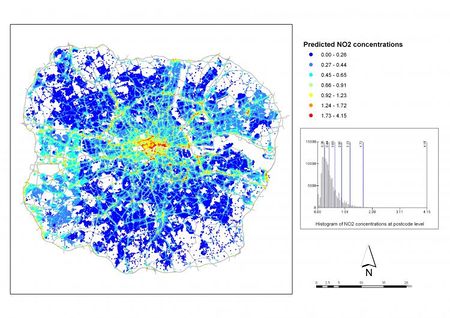
The emission rates were then imported into ADMS-Urban and meteorological data from 1997 to 2002 incorporated to represent typical weather conditions. Modelling was then done for every residential postcode centroid in Greater London (ca. 148,000), for each pollutant and scenario.
Figure 1 shows the absolute difference in estimated exposure between the two scenarios at these postcodes. These differences were used as a basis for estimating the health impact of the policy.