Focal sum modelling: agriculture
- The text on this page is taken from an equivalent page of the IEHIAS-project.
As part of the EU-funded INTARESE project, which contribute to the development of this Toolbox, a case study was carried out to assess the health impacts of agricultural land use change in England and Greece.
While sophisticated dispersion or propagation models are available for air pollution and (to a lesser degree) other environmental media, these cannot always be applied in integrated assessments for a number of reasons. The necessary input may not be available; the computer processing requirements needed to handle large data sets may be excessive; and the models themselves may not be well adapted to, or validated for, the specific pollutants and settings of interest. In these situations a simpler and more generic approach to modelling is required. GIS-based focal sum techniques offer one such approach.
Using agriculture as an example, the following illustrates how the focal sum method can be applied to model atmospheric concentrations of pesticides, PM, endotoxins or pollen.
Case study for England
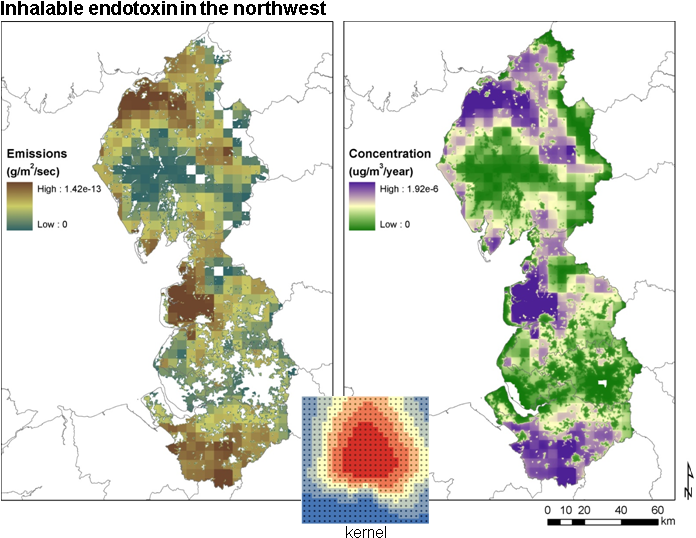
Focal sum modelling requires, first, the specification of a kernel file, defining the search window and distance-based weights that will be applied applied to the gridcells it contains. This can be defined on the basis of prior knowledge or expectation, but specification is likely to be more reliable if it is derived from real-world data or independent modelling of the processes involved. In this case, a proprietary Gaussian dispersion model (ADMS) was run for a small test area in both East Anglia and north-west England. Hourly wind speed, wind direction, cloud cover and temperature data for one meteorological station in each study area was used to represent typical weather conditions, and the source cell was assigned 1 µg/m2 emissions of an inert, gaseous pollutant species. Predicted values were obtained for a fine resolution receptor lattice, and these then averaged to a 250x250m grid to create the weighted kernel file, matching the resolution of the available pesticide emission grids. For each study area, the area-specific kernel file was then used in an ArcGIS focalsum function to produce a grid of annual mean pesticide concentrations. This procedure is shown in Figure 1. Figures 2 and 3 illustrate the emission grids, kernel files and resultant concentration grids for East Anglia and the northwest, respectively.
Figure 1. Focal sum procedure using dispersion model output.
Figure 2. East Anglia insesticides
Figure 3. Northwest England: inhalable endotoxins
Case study for Greece
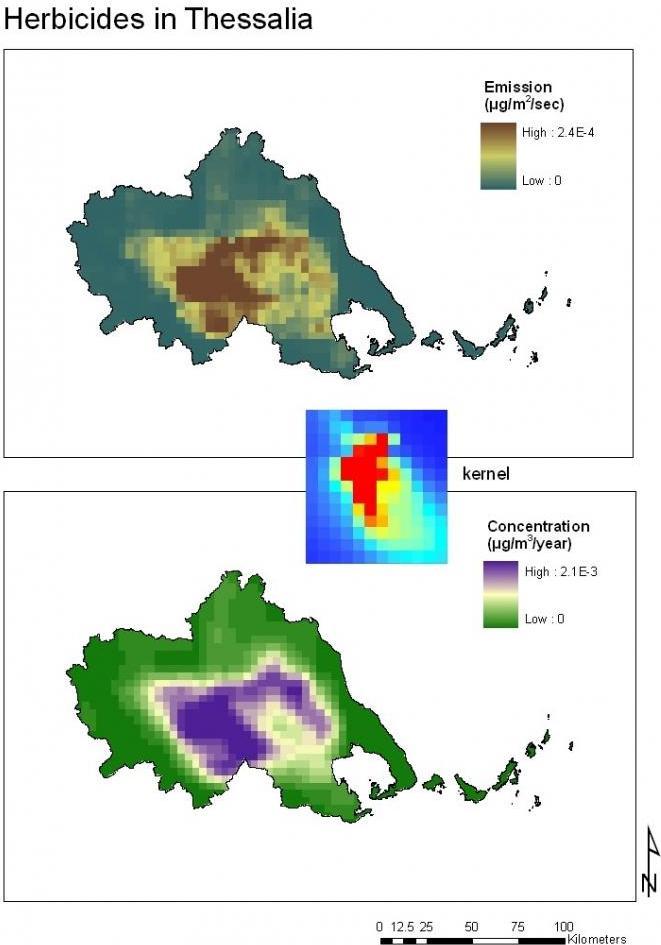
The ArcInfo Focalsum function was implemented to estimate the yearly average concentration of pesticides in air, in the Greek case study. The CALPUFF dispersion model was run in each Region of study (Thessalia, C. Macedonia) using a single area source (4 x 4 km) emitting 1 μg/m2/sec (unit emission) of an inert gas. Yearly average meteorological data (wind speed and direction, temperature, relative humidity) from six meteorological stations (three for each region) were used. A kernel file including concentrations from the CALPUFF output was generated. This file is representative of the dispersion of pesticides around a 4 x 4 km cell. The pesticides emission data were gridded at 4 x 4 km and used together with the kernel file as input to the ArcInfo Focalsum function for estimating dispersed species concentration. The emission data, the kernel files and the estimated concentration for the baseline year 2000 in Thessalia and C. Macedonia are presented in the Figure 4, below.
Figure 4. Modelled pesticide concentrations in Thessalia (top) and Central Macedonia (bottom)


