PBPK model in assessing population exposure to cadmium
- The text on this page is taken from an equivalent page of the IEHIAS-project.
A PBPK model for cadmium was used to assess population exposure to cadmium in the Northern Campine region of Belgium. This region is characterized by historical pollution from non-ferrous industry, resulting in elevated exposures to cadmium and other metals in the population.
Biomonitoring data were gathered for 1217 study participants living in the area, spread out over a study area and a reference area. Cadmium was measured in blood and in urine. Individual questionnaires were filled out and used as a basis for statistical correlation analysis and exposure assessment. Environmental measurements were carried out in and around 100 residences, including sampling and analysis of soil, settled dust and street dust. Cadmium levels in air and deposited dust were determined, as well as cadmium in vegetables.
An external dose model was constructed to estimate the actual exposure of the population based on measured cadmium levels in the environment, lifestyle information from the questionnaires and physiological parameters. Historical concentrations were estimated from available sources to enable the prediction of lifetime exposure. The external dose model was coupled with the Kjellström & Nordberg based PBPK model to predict age-specific levels of cadmium in blood and urine. Model predictions were compared with biomarker measurements and interpreted with regard to routes and pathways of exposure.
Background
The Northern Campine region of Belgium has a legacy of metal contamination due to historical emissions from non-ferrous industry. Potential health effects due to cadmium contamination have been studied since the 1980s. A publication on the elevated lung cancer incidence due to cadmium exposure in the region, lead to a policy initiative in which the actual exposure of the population to cadmium (and arsenic) was determined. For this purpose, a population survey was organized with the following objectives:
- measure actual exposure to cadmium (and arsenic) in the population around the non-ferrous plants (present and past) ;
- assess whether exposure has decreased compared to previous investigations;
- determine the main pathways of exposure.
Methodology
Study area
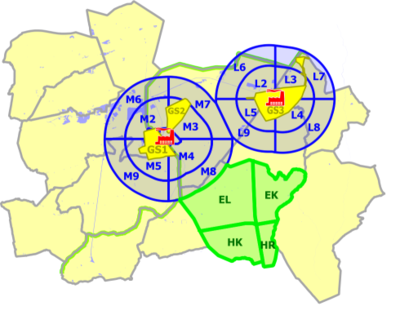
The study was set up to enable an optimal comparison of the obtained results with earlier studies in the region (PheeCad and CadmiBel studies). The study area is shown in Figure 1.
Three zones were distinguished. The first zone ("GS" in yellow) corresponds to the residential areas located closest to the non-ferrous smelters and have the same delineation as in the PheeCad and Cadmibel studies. The third zone is the reference area (in green), also corresponding to the reference area of the earlier studies. The second zone ("M" or "L", in blue) is the wider area of the municipalities around a non-ferrous smelter, not covered by the first zone.
Biomonitoring
A number of 1217 participants were recruited in 2007 for taking part in the biomonitoring campaign. Particpants had to meet following selection criteria:
- aged 20 - 80 years;
- having lived in the area since at least 8 years;
- not be a worker in the non-ferrous industry.
Participants were equally distributed over the three zones. Questionnaires collected information on physiological parameters, lifestyle and health indicators. Blood and urine samples were collected and analyzed for cadmium (and arsenic). Cadmium determined in blood provides a measure of recent exposure, while urinary cadmium is an indication of cumulated, lifelong exposure. Serum ferritine was measured to determine the iron status of the participant. Urinary creatinine was measured to normalize urinary cadmium levels.
Environmental measurements
Among the participants, 100 houses were selected for environmental measurements. 90 homes were located in the research area and 10 homes in the reference area. Street dust, settled house dust and soil were collected for each location. If a private well or a vegetable garden was present, samples were taken. Indoor suspended dust was sampled in a subset of the homes. Settled dust and outdoor suspended dust was sampled at a selection of 14 public places. All samples were analyzed for cadmium, arsenic and lead. Exposure modeling
An external exposure model for calculating cadmium intake was developed and coupled with a Kjellström & Nordberg based PBPK model for cadmium. Two sets of simulations were run. The first set of simulations was done on an individual basis, covering the participants for which environmental measurements were available within the study. The second set of simulation results was calculated for subpopulation level, where subpopulations were based on area of residence, age and lifestyle.
As the PBPK model simulates lifelong exposure to cadmium, which is required to generate adequate results for cadmium in urine (and to a lesser extent for cadmium in blood), a reconstruction of past intakes was needed in addition to the estimate of actual intake.
Inhalatory intake included the inhalation of cadmium in indoor/outdoor air, cadmium from active smoking and cadmium from passive smoking. Intake was estimated on the basis of available levels, inhalation rate, reported time-acivity patterns and smoking patterns. Intake from food distinguished between consumption of locally grown vegetables and of regional food products, bought from the store. Food consumption data and the fraction of self-grown vegetables were taken from the questionnaire data. Cadmium levels in garden vegetables were either determined from measurements or were predicted by transfer functions based on soil cadmium concentrations and soil and plant properties. Other food concentration data were obtained from food safety studies. Intake from soil and dust was modelled on the basis of measured soil and dust concentrations and default soil and dust ingestion rates. Soil concentrations for population level calculations were complemented with data from other recent surveys in the area.
The pharmacokinetic model used is described in PBPK model for cadmium.
The study collected only information on actual personal data and exposure levels. To allow for an estimation of historical exposure and extrapolate exposure to the future (as cumulative exposure to cadmium is related to health effects), additional data and models were used. Body weight is the basis for deriving inhalation rate, kidney weight and blood volume, and creatinine excretion. Past and future body weights were estimated from actual reported body weight and growth curves for the Belgian population (using age and percentile as variables). Historical levels of cadmium in air were estimated from measurements back to 1992 and from time trends in reported emissions for earlier years. Indoor air levels were assumed to follow the same time trend as the outdoor levels. Historical levels in food were estimated from available food consumption studies. Historical levels in local vegetables were estimated to follow the same trend plus an increase following the local trend in atmospheric deposition for leafy vegetables. Soil concentrations were kept constant over time, whereas settled house dust was increased with a pattern similar to the deposition trend.
Results
Individual simulations
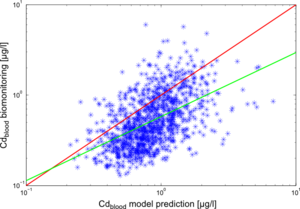
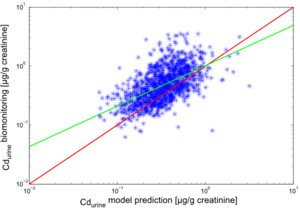
The results of the individual simulations were contrasted with the biomonitoring data, collected for each of the study participants. The results for cadmium in blood (Cdblood) and cadmium in urine (Cdurine) are shown in Figures 2 and 3, respectively.
The predictions for Cdurine also show a good agreement with the trends observed in the biomonitoring. In this case, a slight underprediction by the model with a factor 0,83 is observed.
The deviations of model predictions from the biomonitoring measurements can be explained by the numerous uncertainties involved in the modelling chain.
The reconstruction and estimation of enviromnental cadmium levels in the past is one important factor to consider: historical measurements are scarce and only go back to the '80s. For further extrapolations, only general trend descriptions and expert opinion were available.
Exposure route analysis
The availability of a working model allows for the quantification of the roles of the various exposure routes in determining the total cadmium intake.
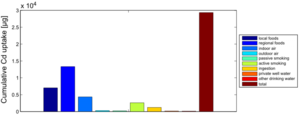
Figure 4 shows the exposure route balance for the current cadmium uptake of the studied population. Note that the graph shows uptake quantities, i.e., the absorbed doses of Cd that are actually taken up in the human body. This differs from the intake or external exposures as they are calculated in the external dose model.
From this figure, we can summarize that food constitutes by far the most important exposure route for cadmium intake. This is an overview of all 1217 participants, which means that the impact of local food consumption and active smoking is averaged out: the data contain both local food consumers as non-consumers, and also smokers and non-smokers.
Contrasting Figure 5 with Figure 4 shows some interesting differences. Both inhalation of indoor air as the ingestion of soil and dust particles gain in importance. This is caused by the strongly elevated cadmium levels in suspended and settled dust in the past.
Also, the impact of local food consumption was clearly more important in the past. This relates to a changing lifestyle: people used to grow and consume local foods more in the past than nowadays.
Historical versus current exposure to cadmium
Simulations were performed for situations in which air concentrations, soil & dust concentrations and food concentrations were elevated. These simulations show a similar picture as Figures 4 and 5: food and suspended particulate matter are the important factors in determining the cadmium burden (results not shown).
Another scenario was simulated for a person experiencing two different histories of cadmium exposure: (i) the actual cadmium exposure during his lifetime, as reconstructed in the model based on historical data, and (ii) a constant cadmium exposure, equal to the cadmium exposure levels measured at the time of the study (2007).
This comparison is shown in Figure 6 and allows us to estimate the burden differences between a person who has lived in the study area all his life until now, versus a person who is born now and will experience the current cadmium levels for the rest of his life. These simulations answer the question "compared to the past, is it safe to grow up in the region these days, given the current cadmium presence?".
The results show the two simulated situations contrasted against each other. It shows that today's cadmium exposure has a significantly lower impact on the urinary cadmium burden during the whole lifetime, compared with the reconstructed historical cadmium exposures in the past.
Comparison of various subpopulations
Comparisons of the cadmium burden were made between subpopulations of the study participants, based on several criteria. Studied criteria were:
- zone of residence (GS zones, M/L zones or reference zones)
- smoking behavior: smokers versus non-smokers
- consumption of locally grown vegetables:
- age groups: youngers versus older age groups
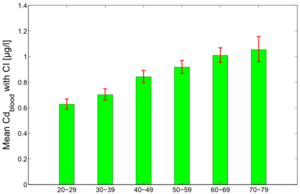
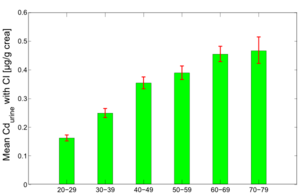
Figure 7 and 8 show the average predicted Cdblood and Cdurine burdens for the separate age groups in the study population: 20-29y, 30-39y, 40-49y, 50-59y, 60-69y and 70-79y.
The figures show the clear effect of age on the cadmium burden, both in blood and urine. Since urinary cadmium is considered to be the measure for lifelong cadmium exposure, age effects are more outspoken for this biomarker. While blood cadmium does also show some age effect, it is considered to be more indicative of recent exposure.
Evaluating external doses
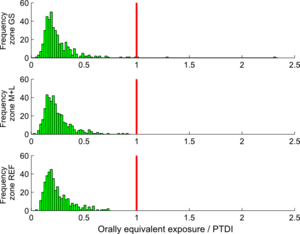
Based on the PTDI value of 1,0 µg Cd/kg.day, the calculated cadmium intakes for the study population could be evaluated. Figure 9 shows the comparison of the calculated intakes (as orally equivalent intakes) with the mentioned PTDI value, separately for the three zones in the study area (GS zones, M+L zones and reference zones).
Note that the intakes shown in this graph are calculated using the external dose model, no PBPK modelling is involved.
The graph shows that there is no real problem for zones M+L and reference (REF). In the central GS zones, some individual cases exceeding the PTDI threshold are observed.
Indication of the lifelong cancer risk
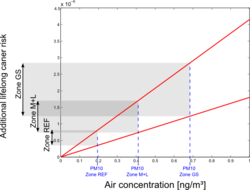
Based on a unit risk approach, the cadmium-related additional risks for lung cancer were calculated. Several unit risk values were found in literature, and based on the WHO and US-EPA values, a range of 1,8 × 10⁻³ to 4.15 × 10⁻³ was selected. Average air cadmium concentrations were derived for each of the three main zones, and were combined with the unit risk values to obtain estimates of the additional lifelong lung cancer risk. Results are shown in Figure 10.
For the central GS zones, risks are estimated from 1,23 × 10⁻⁶ to 2,84 × 10⁻⁶. For the reference area, we end up with 3,5 × 10⁻⁷ to 8,08 × 10⁻⁷.
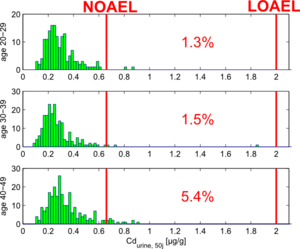
Estimation of future exceedance of urinary cadmium NOAEL limits
The simulation model also allows us to make estimations for the future levels of urinary cadmium for the study participants. In general, a peak in urinary cadmium is expected around age 50.
We used the simulation model to make future predictions of the urinary cadmium burden for all persons younger than 50 years. By comparing the predicted urinary cadmium levels with a NOAEL value of 0,66 µg/g creatinine (as calculated in the EU RAR proposal for cadmium, see ECB (2004)), we can estimate what percentage of the population is at risk of exceedance.
Figure 11 shows the results of these simulations, split up for age groups 20-29y, 30-39y and 40-49y.
This figure shows that there still is a risk of exceeding the NOAEL limits the the study population. The results also clearly show the effect of age: people above age 40 clearly show higher risks than people below age 30. This can be explained by the fact that the former have experienced higher enviromnental levels of cadmium in the past, caused by the higher cadmium emissions.
Conclusions
The implementation of an external exposure model coupled with a dynamic PBPK model describing the intra-body dynamics of cadmium, allows for a detailed and thorough analysis of the exposure dynamics in a region like the Northern Campines. The availability of biomonitoring results has allowed us to validate this integrated exposure model, showing that it succeeds in reproducing the trends found in the biomonitoring measurements.
The model allowed the following insights:
- an analysis of the contributions of the different exposure routes to total cadmium intake has shown that food is the main contributor to the cadmium body burden.
- model simulations illustrate that impact of the current environmental cadmium levels in the region are strongly decreased, when compared to the estimated cadmium exposures in the past.
- an analysis of various subgroups using the model allowed us to quantify the impact of the consumption of locally grown vegetables, of smoking, of the location of residence and of age. The impact of age is clearly observed in the urinary cadmium levels predicted by the model.
- A comparison of calculated cadmium intakes by the external exposure model with the WHO-based PTDI value, shows little exceedances of this threshold.
- By adopting a unit risk approach, additional lifetime lung cancer risks can be calculated. Results show that the risks in the region around the non-ferrous sites varies from 7,4×10⁻⁷ to 1,7×10⁻⁶ in the M+L region, and from 1.2×10⁻⁶ to 2,84×10⁻⁶ in the central GS zones.
- Simulations allow us to predict urinary cadmium levels at age 50, for all study participants younger than 50 at the time of the study. The predictions show that there still is a risk of exceeding the NOAEL value.
The biomonitoring and modelling results described were used by governmental bodies to plan follow-up projects in the region, aiming to increase the awareness of the public to the cadmium issues and to provide them with guidelines to minimize the risks caused by the cadmium presence.
