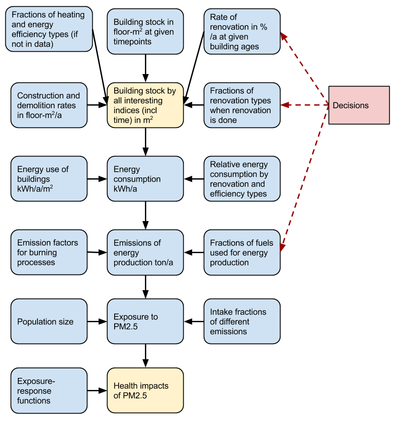
+ Show code- Hide code
library(OpasnetUtils)

#########3# Calculate all building events (constructions, demolitions, renovations)

buildings <- Ovariable("buildings",
	dependencies = data.frame(Name = c(
		"stockBuildings", # Building stock given as an amount at given timepoints
		"stockHeatingShares", # Heating types of current buildings
		"stockEfficiencyShares", # Energy efficiency types of current buildings
		"changeBuildings", # Construction or demolition rate as floor-m2. Indices Efficiency and
			# Heating should be included here, if used.
#		"buildingTypes", # A dummy variable to combine two different indices: Building and Building2
		"renovationShares", # Fraction of renovation type when renovation is done.
		"rateBuildings", # Percentage of renovations and other relative changes per year
#		"eventyear", # A dummy variable to combine time periods to numerical time axis.
		"obsyear" # A data.frame of years for which observations are calculated. This requires timepoints function.
	)),
	formula = function(...) {
		# Current building stock
		stock <- stockBuildings * stockHeatingShares * stockEfficiencyShares

		# Annual changes of floor amount in time multiplied by time, fraction of energy classes and heating types.
		timelength <- Ovariable(
			output = data.frame(
				obsyear,
				Result = c(diff(obsyear[[1]]), 0)
			),
			marginal = c(TRUE, FALSE)
		)

		change <- changeBuildings * timelength
		change <- timepoints(change, obsyear) # Cumulative changes at certain timepoints.

		stock@output <- orbind(stock, change)
		rate <- stock * rateBuildings * rateHeatingShares * rateEfficiencyShares

		temp1 <- EvalOutput(Ovariable("temp1", data = orbind(Now, New))) # All construction
		temp1 <- unkeep(temp1, cols = "Building2", sources = TRUE, prevresults = TRUE)
		# All source indices can be unkept, because each has only one location.

		renovationyear <- Ovariable("renovationyear", data = data.frame(
			Renovationyear = c(2015, 2025, 2035, 2045),
			Age = NA,
			Result = 1
		))
		reno <- temp1 * renovationyear # reno is the building stock repeated for every potential renovation decade.

		reno@output$Age <- as.numeric(as.character(reno@output$Renovationyear)) -
			as.numeric(as.character(reno@output$Eventyear))

		# Floor area of renovations in ten years. Combine with continuous index Age.
		reno <- continuousOps(reno, rateBuildings, '*') * renovationShares * 10
		reno@output$Eventyear <- reno@output$Renovationyear # Renovation is the new event.
		reno <- unkeep(reno, cols = c("Age", "Renovationyear"), sources = TRUE, prevresults = TRUE)

		temp2 <- orbind(temp1 * 1, reno * -1) # Equal amount stops being non-renovated.
		temp2$Renovation <- "None"
		temp2 <- orbind(temp2, reno) # Temp2: Construction + renovation in data.frame
		temp2$Renovation <- as.factor(temp2$Renovation)

		temp3 <- EvalOutput(Ovariable("buildings", data = temp2)) # Temp3: Like Temp2 but ovariable
		temp3 <- unkeep(temp3, sources = TRUE, prevresults = TRUE)
		temp3@output <- fillna(temp3@output, marginals = colnames(temp3@output)[temp3@marginal])
		colnames(temp3@output)[colnames(temp3@output) == "City area"] <- "City.area"

		# temp4: Drop redundant time indices
		temp4 <- oapply(temp3, cols = c("Constructed", "Renovationyear", "Age"), FUN = "sum", na.rm = TRUE)
		temp4@output <- temp4@output[!is.na(result(temp4)) , ]

		# Calculate cumulative events at timepoints defined by obsyear.
		out <- timepoints(temp4, obsyear = obsyear)
		return(out)
	}
)

### HeatingEnergy

heatingEnergy <- Ovariable("heatingEnergy",
	dependencies = data.frame(Name = c(
		"energyUse", # Energy consumption per floor area
		"efficiencyRatio", # Relative energy consumption compared with the efficiency group Old.
		"renovationRatio", # Relative energy consumption compared with the Renovation
		"buildings",
		"buildingTypes"
	)),
	formula = function(...) {

		out <- buildings * buildingTypes * energyUse * efficiencyRatio * renovationRatio

		return(out)
	}
)

objects.store(buildings, heatingEnergy)

cat("Saved ovariables buildings, heatingEnergy\n")
| |
