Building model: Difference between revisions
Jump to navigation
Jump to search
(→Calculations: buildings still need bug fix) |
|||
| Line 20: | Line 20: | ||
library(OpasnetUtils) | library(OpasnetUtils) | ||
######### | ########## Calculate all building events (constructions, demolitions, renovations) | ||
buildings <- Ovariable("buildings", | buildings <- Ovariable("buildings", | ||
| Line 32: | Line 32: | ||
"renovationShares", # Fraction of renovation type when renovation is done. | "renovationShares", # Fraction of renovation type when renovation is done. | ||
"rateBuildings", # Percentage of renovations and other relative changes per year | "rateBuildings", # Percentage of renovations and other relative changes per year | ||
"year" # A data.frame of years for which observations are calculated. This requires timepoints function. | "year" # A data.frame of years for which observations are calculated. This requires timepoints function. | ||
)), | )), | ||
formula = function(...) { | formula = function(...) { | ||
# Current building stock | ######## Current building stock | ||
stock <- stockBuildings * heatingShares * efficiencyShares | stock <- stockBuildings * heatingShares * efficiencyShares | ||
# if(!"Startyear" %in% colnames(stock@output)) { # Make a duplicate of Time because Startyear is needed later. | |||
# marginals <- colnames(stock@output)[stock@marginal] | |||
# stock@output$Startyear <- stock@output$Time | |||
# stock@marginal <- colnames(stock@output) %in% c(marginals, "Startyear") | |||
# } | |||
#### Changes in building stock due to construction etc. | #### Changes in building stock due to construction etc. | ||
| Line 49: | Line 48: | ||
# change <- changeBuildings | # change <- changeBuildings | ||
change <- timepoints(changeBuildings, obsyear, sumtimecol = FALSE) # Cumulative changes at certain timepoints. | change <- timepoints(changeBuildings, obsyear, sumtimecol = FALSE) # Cumulative changes at certain timepoints. | ||
nw <- stock | |||
nw@output$Time <- as.numeric(as.character(nw@output$Time)) | |||
nw@output <- subset(nw@output, Time == max(Time)) | |||
colnames(nw@output)[colnames(nw@output) == "Time"] <- "Startyear" | |||
changeBuildings@output$Startyear <- as.numeric(as.character(changeBuildings@output$Startyear)) | |||
nw <- unkeep(nw, prevresults = TRUE, sources = TRUE) | |||
nw@output <- orbind(nw, unkeep(1 * changeBuildings, prevresults = TRUE, sources = TRUE)) | |||
# | # nw <- | ||
# stock <- unkeep(change, cols = "Startyear") | |||
# change@marginal <- colnames(change@output) %in% c( | |||
# "Age", | |||
# colnames(stock@output)[stock@marginal], | |||
# colnames(changeBuildings@output)[changeBuildings@marginal] | |||
# ) | |||
# change <- unkeep(change, cols = "Startyear", prevresults = TRUE, sources = TRUE) | |||
# Floor area of renovations | ########### Floor area of renovations. Combine with continuous index Age. | ||
reno <- | reno <- nw * renovationShares | ||
reno@output$ | marginals <- colnames(reno@output)[reno@marginal] | ||
reno <- | reno@output$Age <- as.numeric(as.character(reno@output$Time)) - | ||
as.numeric(as.character(reno@output$Startyear)) | |||
reno@marginal <- colnames(reno@output) %in% marginals | |||
reno <- reno * 0.03 # continuousOps(reno, renovationRate, '*') FIX continuousOps | |||
reno@output$Startyear <- reno@output$Time # Renovation is the new event. | |||
reno <- oapply(reno, cols = c("Age", "Time"), FUN = sum) | |||
reno <- timepoints(reno, obstime) | |||
reno@output <- reno@output[result(reno) != 0 , ] | |||
out <- reno * -1 # Equal amount stops being non-renovated. | |||
out@output$Renovation <- "None" | |||
out@output$Renovation <- as.factor(out@output$Renovation) | |||
out <- orbind(out, reno) # Temp2: Construction + renovation in data.frame | |||
for(i in colnames(reno@output)[reno@marginal]) { | |||
out[[i]][is.na(out[[i]])] <- "Not known" | |||
} | |||
return(out) | return(out) | ||
} | } | ||
Revision as of 21:43, 16 February 2015
| Moderator:Jouni (see all) |
|
|
| Upload data
|
Question
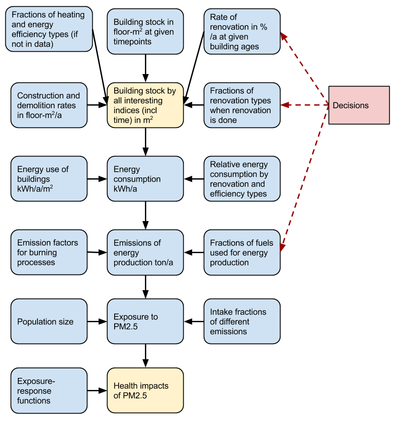
How to estimate the size of the building stock of a city, including heating properties, renovations etc? The situation is followed over time, and different policies can be implemented.
Answer
For examples of model use, see Building stock in Kuopio and Climate change policies and health in Kuopio.
Rationale

Calculations
Dependencies
- Exposure to PM2.5 in Finland
- OpasnetUtils/Drafts
- Energy use of buildings
- Ovariables used or produced and example pages where they are used:
- Building stock in Kuopio
- buildingStock, # Current building stock
- renovation, # Percentage of renovations per year
- renovationShares, # Fraction of renovation type when renovation is done.
- construction, # Construction rate in the future
- constructionAreas,
- buildingTypes, # A dummy variable to combine two different indices: Building and Building2
- heatingShares, # Heating types of current buildings
- heatingSharesNew, # Heating types of the buildings in the future
- buildings,
- Energy use of buildings
- energyUse,
- efficienciesNew, # Energy efficiencies in the future
- savingPotential,
- Climate change policies and health in Kuopio
- eventyear, # A dummy variable to combine time periods to numerical time axis.
- efficiencies, # Energy efficiencies of current buildings
- obsyear # Years for which observations are calculated. This requires timepoints function.
- Building stock in Kuopio
See also
- Building stock in Kuopio
- Building stock in Europe
- Building data availability in Kuopio
- Energy balance
- Greenhouse gas emissions in Kuopio
- heande:File:2013 10 29 - Exposure-Response Functions.xlsx
- heande:Health impact assessment framework
- heande:File:2013 10 29 WP6.2 Agreed ER.doc
- heande:Urgenche: Workpackage Exposure, Health, and Well-being
- heande:File:WP6 Deliverable 6 1.doc
- Land use in Kuopio