Climate change policies and health in Kuopio: Difference between revisions
| Line 46: | Line 46: | ||
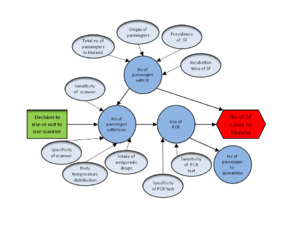
[[image:Causal diagram.PNG|thumb|This diagram is just a placeholder. A new file should be uploaded, because this is about another assessment.]] | [[image:Causal diagram.PNG|thumb|This diagram is just a placeholder. A new file should be uploaded, because this is about another assessment.]] | ||
===Decision variables=== | ===Decision variables=== | ||
Revision as of 14:32, 7 December 2012
| Moderator:Jouni (see all) |
| This page is a stub. You may improve it into a full page. |
| Upload data
|
Scope
Question
What are potential climate policies that reach the greenhouse emission targets in the city of Kuopio for years 2010-2030? What are their effects on health and well-being, and what recommendations can be given based on this? The national greenhouse emission target is to reduce greenhouse gas emissions by 20 % between 1990 and 2020; the city of Kuopio has its own, more ambitious target of 40 % for the same time period.
Boundaries
- Time: Year 2010 - 2030
- Spatial: Activities in Kuopio, Finland. Health and well-being effects due to policies anywhere, e.g. fine particle emissions in Kuopio increase cardiovascular mortality all over Finland.
Intended users
- The city of Kuopio.
- Other cities in Urgenche.
- Urgenche researchers are users from the methodological point of view.
Participants
- Main participants:
- City of Kuopio: Erkki Pärjälä, Mikko Savastola
- THL: Marjo Niittynen, Jouni Tuomisto, Matti Jantunen.
- Other participants:
- University of Exeter
- Universität Stuttgart
- Other Urgenche research groups
- Other Urgenche cities
Answer
Results
Conclusions
The target of 40 % GHG reduction seems realistic.
Rationale
See other parts of the assessment:

Decision variables
- Plausible climate change policies in Kuopio can be found in detail at Climate change policies in Kuopio
- Major policies/aims
- Compared to 1990, 40% reduction in total GHG emissions in Kuopio by 2020.
- Compared to 2005, 9% reduction in city´s own energy use by 2016.
- Major policies/aims
- Specific actions
- Energy production
- New power plant unit in Haapaniemi: ability to use more biomass
- Building stock
- Energy efficiency of buildings is increased: new stricter building regulations in Finland (2/2013)
- Education to building owners and managers: semblance of best practicies in heating and other use of energy. Possible reduction in energy use of building stock is about 10%, and mere beneficial health effects are expected.
- Land use and transport
- City of Kuopio finds out, whether it is possible to get an updated version of Kuopio´s traffic network
- Alternatively, the effect of increased use of biofuels on GHG and CO2 emissions is evaluated.
- Energy production
Indicators
- Cardiovascular mortality
- Pulmonar mortality
- Well-being...
Other variables
Assessment-specific data
| Obs | Name | Identifier | Cell | Direction | Result |
|---|---|---|---|---|---|
| 1 | Climate change policies in Kuopio | Op_en5466 | wide | decisions | |
| 2 | Climate change policies in Kuopio | Op_en5466 | wide | stakeholders | |
| 3 | Climate change policies in Kuopio | Op_en5466 | wide | probabilities | |
| 4 | Energy consumption of heating of buildings in Kuopio | Op_en5699 | Energy source:District heat | wide | heating.energy |
| 5 | Fuels used by Haapaniemi energy plant | Op_en5690 | wide | fuel.fractions | |
| 6 | Emission factors for burning processes | Op_en2791 | wide | emission.factors | |
| 7 | Haapaniemi energy plant in Kuopio | Op_en5688 | Production type:Heat | wide | energy.production |
| 8 | Climate education in Kuopio | Op_en5582 | wide | climate.education | |
| 9 | Cost curves for energy | Op_en5478 | long | cost.curve | |
| 10 | Energy transformations | Op_en5472 | wide | transformation | |
| 11 | Energy balance in Kuopio | Op_en5469 | wide | energy.balance | |
| 12 | Greenhouse gas emissions in Kuopio | Op_en5483 | Sector:District heating | long | GHG.emission |
| 13 | Building registry data | ||||
| 14 | Use of electricity by building type | ||||
| 15 | Use of heat by contract |
Formula
----#: . This is a city-specific copy of the original code: Energy balance. --Jouni 06:52, 27 January 2012 (EET) (type: truth; paradigms: science: comment)
Value variables
Analyses
- Decision analysis on each policy: Which option minimises the health risks?
- Value-of-information analysis for each policy about the major variables in the model and the total VOI.
See also
The average usage of firewood in certain types of houses according to the wain heating system in 2000-2001 in Finland (m^3/household/year)[1]
| Main heating system | Type of estate | ||||
| Detached house | Farm | Free-time place | Total | ||
| Stove heating | 7.1 | 10 | 2 | 4.4 | |
| Central heating | Wood | 13.7 | 25.6 | .. | 18.4 |
| Oil | 1.8 | 8.2 | .. | 2.3 | |
| Electricity | 2.5 | 7.8 | .. | 2.8 | |
| Straight electric heating | 2.9 | 6.5 | 1.6 | 2.7 | |
| District heating | 1.1 | .. | .. | 1.2 | |
| All | 3.8 | 14.4 | 1.8 | 4.4 | |
References
Related files
<mfanonymousfilelist></mfanonymousfilelist>