Building stock in Helsinki
| Moderator:Jouni (see all) |
|
|
| Upload data
|
- During Decision analysis and risk management 2015 course, this page was used to collect student contributions. To see them, look at an archived version. The page has since been updated for its main use. Data in the archived tables was moved: Table 2. Energy parametres of buildings, Table 4. Energy sinks, Table 5. Changes in energy efficiency, Table 6. Important energy parametres. Tables 3, 7, and 8 did not contain data and were removed.
Contents
Question
What is the building stock in Helsinki and its projected future?
Answer
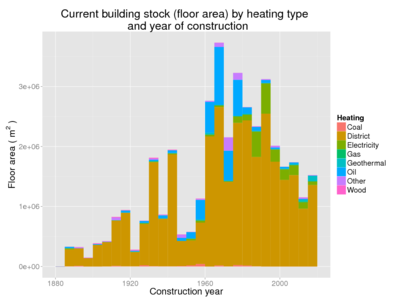
Current building stock in Helsinki by heating type.
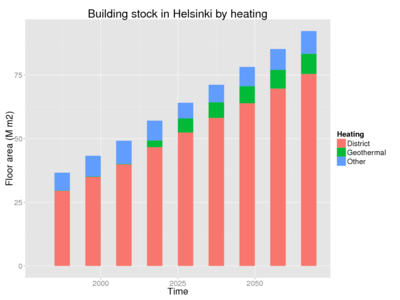
Projected building stock based on 2015 data and urban plans.


Rationale
This part contains the data needed for calculations about the building stock in Helsinki. It shows the different building and heating types in Helsinki, and how much and what kind of renovations are done for the existing building stock in a year, including how much and how old building stock is demolished. This data is used in further calculations in the model.
There is also some other important data that wasn't used in the model's calculations. These include more accurate renovation statistics for residential buildings, U-value changes for renovations and thermal transmittance of different parts of residential buildings. This data is found under Data not used.
Carbon neutral Helsinki 2035
Building stock
These tables are based on FACTA database classifications and their interpretation for assessments. This data is used for modelling. The data is large and can be seen from the Opasnet Base. Technical parts on this page are hidden for readability. Building types should match Energy use of buildings#Baseline energy consumption.
| Show details | |||||||||||||||||||||||||||||||||||||||||||||||||||||||||||||||||||||||||||||||||||||||||||||||||||||||||||||||||||||||||||||||||||||||||||||||||||||||||||||||||||||||||||||||||||||||||||||||||||||||||||||||||||||||||||||||||||||||||||||||||||||||||||||||||||||||||||||||||||||||||||||||||||||||||||||||||||||||||||||||||||||||||||||||||||||||||||||||||||||||||||||||||||||||||||||||||||||||||||||
|---|---|---|---|---|---|---|---|---|---|---|---|---|---|---|---|---|---|---|---|---|---|---|---|---|---|---|---|---|---|---|---|---|---|---|---|---|---|---|---|---|---|---|---|---|---|---|---|---|---|---|---|---|---|---|---|---|---|---|---|---|---|---|---|---|---|---|---|---|---|---|---|---|---|---|---|---|---|---|---|---|---|---|---|---|---|---|---|---|---|---|---|---|---|---|---|---|---|---|---|---|---|---|---|---|---|---|---|---|---|---|---|---|---|---|---|---|---|---|---|---|---|---|---|---|---|---|---|---|---|---|---|---|---|---|---|---|---|---|---|---|---|---|---|---|---|---|---|---|---|---|---|---|---|---|---|---|---|---|---|---|---|---|---|---|---|---|---|---|---|---|---|---|---|---|---|---|---|---|---|---|---|---|---|---|---|---|---|---|---|---|---|---|---|---|---|---|---|---|---|---|---|---|---|---|---|---|---|---|---|---|---|---|---|---|---|---|---|---|---|---|---|---|---|---|---|---|---|---|---|---|---|---|---|---|---|---|---|---|---|---|---|---|---|---|---|---|---|---|---|---|---|---|---|---|---|---|---|---|---|---|---|---|---|---|---|---|---|---|---|---|---|---|---|---|---|---|---|---|---|---|---|---|---|---|---|---|---|---|---|---|---|---|---|---|---|---|---|---|---|---|---|---|---|---|---|---|---|---|---|---|---|---|---|---|---|---|---|---|---|---|---|---|---|---|---|---|---|---|---|---|---|---|---|---|---|---|---|---|---|---|---|---|---|---|---|---|---|---|---|---|---|---|---|---|---|---|---|---|---|---|---|---|---|---|---|---|---|---|---|---|---|---|---|---|---|---|---|---|---|---|---|---|---|---|---|---|---|---|---|---|---|---|---|---|---|---|---|
----#: . Viimeiset 12 riviä (ilman numeroa) ovat tyyppejä jotka ovat datassa (tai ainakin vanhassa taulukossa) mutta puuttuvat Sonjan luokittelusta. --Jouni (talk) 12:57, 24 August 2015 (UTC) (type: truth; paradigms: science: comment) For residential buildings (classes A and B) the classification is kept more detailed than for other buildings. This is because residential buildings are the biggest energy consumers in Helsinki and different classes of residential buildings are examined separately.
The structures of the tables are based on CyPT Excel file N:\YMAL\Projects\ilmastotiekartta\Helsinki Data Input Template - Building Data.xlsx. |
Construction and demolition
It is assumed that construction occurs at a constant rate so that there is an increase of 42% in 2050 compared to 2013. Energy efficiency comes from Energy use of buildings.
Fraction of houses demolished per year.
| Obs | Age | Rate |
|---|---|---|
| 1 | 0 | 0 |
| 2 | 50 | 1 |
| 3 | 1000 | 1 |
Heating type conversion
The fraction of heating types in the building stock reflects the situation at the moment of construction and not currently. The heating type conversion corrects this by changing a fraction of heating methods to a different one at different timepoints. Cumulative fraction, other timepoints will be interpolated.
| Obs | Heating_from | Heating_to | Time | Result |
|---|---|---|---|---|
| 1 | Oil | Geothermal | 2005 | 0 |
| 2 | Oil | Geothermal | 2015 | 0.5 |
| 3 | Oil | Geothermal | 2025 | 1 |
Renovations
Estimates from Laura Perez and Stephan Trüeb, unibas.ch N:\YMAL\Projects\Urgenche\WP9 Basel\Energy_scenarios_Basel_update.docx
| Obs | Age | Result | Description |
|---|---|---|---|
| 1 | 0 | 0 | Estimates from Laura Perez and Stephan Trüeb |
| 2 | 20 | 0 | Assumption Result applies to buildings older than the value in the Age column. |
| 3 | 25 | 1 | |
| 4 | 30 | 1 | |
| 5 | 50 | 1 | |
| 6 | 100 | 1 | |
| 7 | 1000 | 1 |
| Obs | Renovation | Fraction | Description |
|---|---|---|---|
| 1 | None | 0 | |
| 2 | Windows | 65 | |
| 3 | Technical systems | 30 | |
| 4 | Sheath reform | 5 | |
| 5 | General | 0 |
Locations of city areas
- Locations of city areas (hidden for readability).
| Show details | |||||||||||||||||||||||||||||||||||||||||||||||||||||||||||||||||||||||||||||||||||||||||||||||||||||||||||||||||||||||||||||||||||||||||||||||||||||||||||||||||||||||||||||||||||||||||||||||||||||||||||||||||||||||||||||||||||||||||||||||||||||||||||||||||||||||||||||||||||||||||||||||||||||||||||||||||||||||||||||||||||||||||||||||||||||||||||||||||||||||||||||||||||||||||||||||||||||||||||||||||||||||||||||||||||||||||||||||||||||||||||||||||||||||||||||||||||||||||||||||||||||||||||||||||||||||||||||||||||
|---|---|---|---|---|---|---|---|---|---|---|---|---|---|---|---|---|---|---|---|---|---|---|---|---|---|---|---|---|---|---|---|---|---|---|---|---|---|---|---|---|---|---|---|---|---|---|---|---|---|---|---|---|---|---|---|---|---|---|---|---|---|---|---|---|---|---|---|---|---|---|---|---|---|---|---|---|---|---|---|---|---|---|---|---|---|---|---|---|---|---|---|---|---|---|---|---|---|---|---|---|---|---|---|---|---|---|---|---|---|---|---|---|---|---|---|---|---|---|---|---|---|---|---|---|---|---|---|---|---|---|---|---|---|---|---|---|---|---|---|---|---|---|---|---|---|---|---|---|---|---|---|---|---|---|---|---|---|---|---|---|---|---|---|---|---|---|---|---|---|---|---|---|---|---|---|---|---|---|---|---|---|---|---|---|---|---|---|---|---|---|---|---|---|---|---|---|---|---|---|---|---|---|---|---|---|---|---|---|---|---|---|---|---|---|---|---|---|---|---|---|---|---|---|---|---|---|---|---|---|---|---|---|---|---|---|---|---|---|---|---|---|---|---|---|---|---|---|---|---|---|---|---|---|---|---|---|---|---|---|---|---|---|---|---|---|---|---|---|---|---|---|---|---|---|---|---|---|---|---|---|---|---|---|---|---|---|---|---|---|---|---|---|---|---|---|---|---|---|---|---|---|---|---|---|---|---|---|---|---|---|---|---|---|---|---|---|---|---|---|---|---|---|---|---|---|---|---|---|---|---|---|---|---|---|---|---|---|---|---|---|---|---|---|---|---|---|---|---|---|---|---|---|---|---|---|---|---|---|---|---|---|---|---|---|---|---|---|---|---|---|---|---|---|---|---|---|---|---|---|---|---|---|---|---|---|---|---|---|---|---|---|---|---|---|---|---|---|---|---|---|---|---|---|---|---|---|---|---|---|---|---|---|---|---|---|---|---|---|---|---|---|---|---|---|---|---|---|---|---|---|---|---|---|---|---|---|---|---|---|---|---|---|---|---|---|---|---|---|---|---|---|---|---|---|---|---|---|---|---|---|---|---|---|---|---|---|---|---|---|---|---|---|---|---|---|---|---|---|---|---|---|---|---|---|---|---|---|---|---|---|---|---|---|---|---|---|---|---|---|---|---|---|---|---|---|---|---|---|---|---|---|---|---|---|---|
|
The positions listed here are used for exposure modelling. Area code matches with stock detail data on Building stock in Helsinki. The coordinates should be visually checked from http://www.karttapaikka.fi referencing picture X.
|
Data not used
This contains data that was not used in the model's calculations. This includes renovation rates, the rates of heat flowing out of buildings and total floor areas of multiple types of buildings in Helsinki. The floor area data is also found in the background data of this page, which was used in the model.
| Building | Baseline | 2020 | 2025 | 2050 | Year of baseline | Description |
| Residential | 27884795 | 32472388 | 34890241 | 44069914 | 2014 | Building stock of Helsinki area, 2014 |
| Public | 4537025 | 4764475 | 4945952 | 5855546 | 2014 | Building stock of Helsinki area, 2014 |
| Industrial | 3277271 | 3306063 | 3360467 | 3640854 | 2014 | Building stock of Helsinki area, 2014 |
| Other | 10861972 | 11406505 | 11840973 | 13806423 | 2014 | Building stock of Helsinki area, 2014 |
- Notes
- Estimates were based on
 Siemens City Performance toolin seuraava kokous 2.2 and some derived calculations on
  BUILDING STOCK CALCULATION 2015.
 - How to get the numbers for the baseline floor area for residential, public, industrial and other: Residential floor area was named as residential together, public by summing the floor area of health care, education and common buildings, industrial buildings were as such and other buildings comprise of business, traffic, office and storage buildings.
- Ref. Helsinki master plan for 2050: there are 860 000 citizens living in Helsinki (ref. www.yleiskaava.fi, visio2050); Residental buildings => fast growth
- Prediction of citizen number in Helsinki in 2020, 2030, 2040 and 2050 was used for calculations (ref. Helsingin 30% päästövähennysselvitys).
- Helsinki’s climate policy: 30% reduction in emissions: In 2010 the proportion of jobs in services and public sectors was 94%, and in industry 6%. In 2020 the proportion of jobs in services and public sectors is estimated to be 96%, and in industry 4%. Public and other buildings => between fast growth option and basic option, Industry=> Basic option
- Prediction of job number in Helsinki in 2020, 2030, 2040 and 2050 was used for calculations (ref. Helsingin 30% päästövähennysselvitys).
- Tables one and two The presentation of Tables 1 and 2
Technical notes:
- Sheet 4_Input Buildings (Area Demand). Priority 1. Auxiliaries PPT. Absolute increase/decrease rate will be based on the inhabitants projected in time.
- This is another list building types that was considered but rejected as too complex: Residential buildings, Government & public administration buildings, Commercial offices buildings, Data centers buildings, Education and K12 and universitiy buildings, Hospitals and healthcare buildings, Hotels and hospitality and leisure buildings, Exhibitions and fairs and halls buildings, Retail and stores and shops buildings, Warehouses & shopping mall buildings, Industrial buildings, Non residential buildings unspecified.
- There was a problem with missing data. There is more than 400000 m^2 floor area that is missing; this is estimated from total area that is available for these buildings. For other buildings, there is more than 400000 m^2 total area missing from buildings where floor area is given. See statistical analysis [1]. This was corrected by inputation so that is floor area was missing, 0.8*total_area was used instead [2].
| Construction year | Balcony glasses | Windows | Julkisivujen peruskorjaus | Vesikattojen peruskojaus | Lämmönvaihtimen uusiminen | Patteriverkoston säätö | Kylpyhuonekalusteiden vaihto | Patteriventtiilien vaihto | New balcony doors | LTO-laitteen asennus | Water consumption measurements |
|---|---|---|---|---|---|---|---|---|---|---|---|
| -20 | 0,0 % | 1,1 % | 1,1 % | 1,1 % | 1,1 % | 1,1 % | 1,1 % | 1,1 % | 1,1 % | 1,1 % | 1,1 % |
| 21-25 | 0,0 % | 10,3 % | 1,2 % | 11,1 % | 10,3 % | 10,3 % | 1,2 % | 10,3 % | 1,2 % | 10,3 % | 10,3 % |
| 26-30 | 0,0 % | 0,0 % | 0,0 % | 0,0 % | 0,0 % | 0,0 % | 0,0 % | 0,0 % | 0,0 % | 9,5 % | 0,0 % |
| 31-35 | 0,0 % | 0,0 % | 0,0 % | 0,0 % | 0,0 % | 0,0 % | 0,0 % | 0,0 % | 0,0 % | 0,0 % | 0,0 % |
| 36-40 | 0,0 % | 0,0 % | 0,0 % | 0,0 % | 4,2 % | 4,2 % | 0,0 % | 0,0 % | 0,0 % | 4,2 % | 0,0 % |
| 41-45 | 0,0 % | 16,7 % | 0,0 % | 16,7 % | 16,7 % | 16,7 % | 0,0 % | 16,7 % | 0,0 % | 16,7 % | 16,7 % |
| 46-50 | 0,0 % | 5,2 % | 0,0 % | 7,4 % | 7,4 % | 7,4 % | 0,0 % | 7,4 % | 0,0 % | 5,2 % | 5,2 % |
| 51-55 | 0,0 % | 11,3 % | 0,0 % | 8,8 % | 8,8 % | 8,8 % | 0,0 % | 8,8 % | 0,0 % | 8,8 % | 16,2 % |
| 56-60 | 0,0 % | 5,4 % | 0,0 % | 4,9 % | 6,2 % | 7,1 % | 0,0 % | 6,2 % | 4,5 % | 4,5 % | 5,4 % |
| 61-65 | 0,0 % | 1,5 % | 1,3 % | 0,8 % | 2,9 % | 2,4 % | 1,0 % | 2,4 % | 0,9 % | 0,9 % | 2,9 % |
| 66-70 | 0,6 % | 2,9 % | 1,2 % | 2,8 % | 1,4 % | 2,3 % | 1,1 % | 1,1 % | 0,1 % | 1,1 % | 1,1 % |
| 71-75 | 3,2 % | 3,1 % | 3,4 % | 2,9 % | 3,1 % | 2,6 % | 0,2 % | 1,1 % | 0,2 % | 0,2 % | 0,2 % |
| 76-80 | 0,1 % | 2,7 % | 0,1 % | 0,7 % | 2,0 % | 1,7 % | 1,1 % | 1,2 % | 0,2 % | 0,4 % | 0,2 % |
| 81-85 | 1,0 % | 2,8 % | 0,7 % | 2,3 % | 3,3 % | 4,8 % | 3,5 % | 0,0 % | 0,0 % | 0,0 % | 0,8 % |
| 86-90 | 0,0 % | 1,3 % | 0,0 % | 2,1 % | 6,1 % | 1,6 % | 0,7 % | 1,8 % | 0,3 % | 0,3 % | 1,0 % |
| 91-95 | 0,6 % | 0,3 % | 0,0 % | 3,9 % | 8,6 % | 1,9 % | 5,1 % | 0,8 % | 0,2 % | 0,0 % | 1,3 % |
| 96-00 | 0,1 % | 0,0 % | 0,0 % | 0,6 % | 1,2 % | 1,0 % | 1,5 % | 1,0 % | 0,0 % | 0,0 % | 4,2 % |
| 01-05 | 2,9 % | 0,0 % | 0,0 % | 0,0 % | 1,2 % | 1,0 % | 0,0 % | 1,0 % | 0,0 % | 0,0 % | 0,7 % |
| 06-10 | 1,7 % | 0,0 % | 0,0 % | 0,0 % | 0,5 % | 0,5 % | 0,0 % | 0,5 % | 0,0 % | 0,0 % | 0,0 % |
←--#: . In the document there are similar tables for total renovations from 2010 onwards to years 2016, 2020 and 2050. --Heta (talk) 09:28, 16 June 2015 (UTC) (type: truth; paradigms: science: defence)
| Action | The feature in question | Difference to before | Unit | Notes |
|---|---|---|---|---|
| Glass for balconies | U-value for windows | -0,3 | W/m2,K | Säästö 1-4% rakennustasolla |
| Changing the windows | U-value for windows | -1 | W/m2,K | Vanhoista osa kaksilasisia ja osa kolmilasisia. Uudes 1,0 W/m2,K tai alle |
| Julkisivun peruskorjaus | U-value of walls | -0,2 | W/m2,K | U-arvo puolitetaan eli n. 100 mm lisäeristys |
| Vesikattojen peruskorjaus | Yläpohjan U-arvo | -0,15 | W/m2,K | Oletetaan 50% lisäeristys U-arvo puoleen eli n. 100 mm lisäerstys |
| Balcony door change | U-value of doors | -0,5 | W/m2,K | Tiivistyminen tuo lisäsäästöä |
| Construction decade | Thermal transmittance factors for building components (W/m2K) | Ventilation and leakage air rates (1/h) | |||||||
| Floor | Roof | Walls | Windows | Outdoors | Supply air through the heat recovery unit | Supply air bypassing the heat recovery unit | Leakage air | ||
| Before 1980 | Single family house | 0.52 | 0.32 | 0.54 | 2.14 | 1.18 | 0.30 | 0.05 | 0.20 |
| Row house | 0.52 | 0.36 | 0.56 | 2.15 | 1.00 | 0.3 | 0.05 | 0.20 | |
| Apartment building | 0.59 | 0.37 | 0.61 | 2.18 | 1.40 | 0.37 | 0.00 | 0.10 | |
| 1980's | Single family house | 0.30 | 0.21 | 0.28 | 1.70 | 1.00 | 0.30 | 0.05 | 0.15 |
| Row house | 0.32 | 0.22 | 0.30 | 1.70 | 1.00 | 0.30 | 0.05 | 0.15 | |
| Apartment building | 0.34 | 0.23 | 0.29 | 1.80 | 1.40 | 0.35 | 0.00 | 0.10 | |
| 1990's | Single family house | 0.25 | 0.20 | 0.25 | 1.70 | 1.00 | 0.30 | 0.05 | 0.15 |
| Row house | 0.32 | 0.22 | 0.28 | 1.70 | 1.00 | 0.30 | 0.05 | 0.15 | |
| Apartment building | 0.332 | 0.22 | 0.28 | 1.75 | 1.40 | 0.38 | 0.00 | 0.10 | |
| 2000's | Single family house | 0.24 | 0.17 | 0.24 | 1.40 | 1.00 | 0.30 | 0.05 | 0.13 |
| Row house | 0.28 | 0.18 | 0.26 | 1.50 | 1.00 | 0.45 | 0.05 | 0.15 | |
| Apartment building | 0.28 | 0.18 | 0.26 | 1.50 | 1.40 | 0.55 | 0.00 | 0.10 | |
| 2010's | Single family house | 0.16 | 0.09 | 0.17 | 1.00 | 1.00 | 0.30 | 0.05 | 0.10 |
| Row house | 0.16 | 0.09 | 0.17 | 1.00 | 1.00 | 0.50 | 0.05 | 0.15 | |
| Apartment building | 0.16 | 0.09 | 0.17 | 1.00 | 1.00 | 0.60 | 0.00 | 0.10 | |
See also
- Building stock in Helsinki metropolitan area
- Descriptions about the summary calculations on sheet Parameter Balance (not needed any more).
- Rakennustietoruudukko pääkaupunkiseudulta [3]
- Unit heat consumption of buildings in Finland
- Sitra, page 25
- Tee parannus pages 8-9, also 40-45
- VTT tiedotteet page 20-21, also 30, 80
- Heating consumption of buildings
- Lämmitystapavalintojen kehitys
References
- ↑ 1.0 1.1 HAESS Final report, Tampere University of Technology, 2010
- ↑ MK Mattinen, J Heljo, J Vihola, A Kurvinen, S Lehtoranta, A Nissinen: Modeling and visualisation of residential sector energy consumption and greenhouse gas emissions
