Benefit-risk assessment on farmed salmon: Difference between revisions
Jump to navigation
Jump to search
(→Definition: variable list replaced by Template:Farmed salmon assessment) |
(→Results: result table compared with BAU added) |
||
| Line 52: | Line 52: | ||
[[Image:Benefit-risk diagram for farmed salmon.PNG]] | [[Image:Benefit-risk diagram for farmed salmon.PNG]] | ||
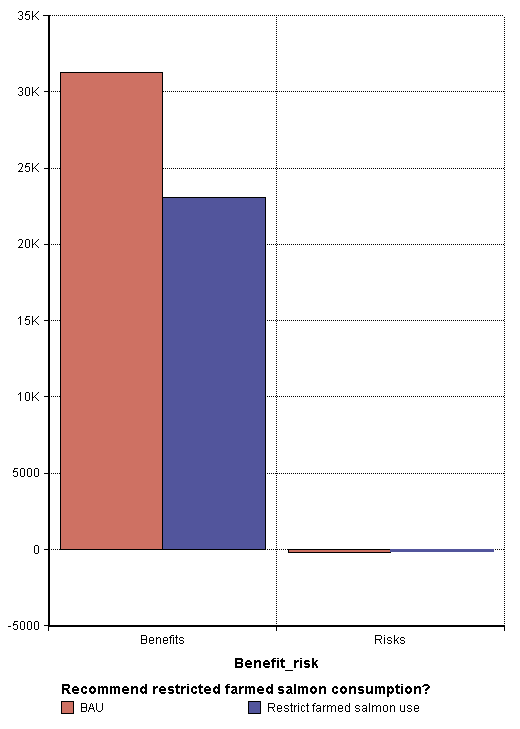
Table: Net health impacts of eating farmed salmon. The results include the health impacts of the total health impact of omega-3 intake from salmon. | |||
{| {{prettytable}} | {| {{prettytable}} | ||
| Line 128: | Line 130: | ||
|} | |} | ||
Table: Net health impacts of eating farmed salmon compared with the business-as-usual scenario. | |||
{| {{prettytable}} | |||
|Statistics or fractile | |||
|Business as usual | |||
|Recommend restrictions | |||
|Stricter rules for feed | |||
|Both | |||
|---- | |||
|Mean | |||
|0 | |||
| -8133 | |||
|366 | |||
| -7766 | |||
|---- | |||
|SD | |||
|0 | |||
|9703 | |||
|982 | |||
|9637 | |||
|---- | |||
|0.01 | |||
|0 | |||
| -45895 | |||
| -2335 | |||
| -45557 | |||
|---- | |||
|0.025 | |||
|0 | |||
| -35624 | |||
| -1662 | |||
| -35171 | |||
|---- | |||
|0.05 | |||
|0 | |||
| -27745 | |||
| -1155 | |||
| -27041 | |||
|---- | |||
|0.25 | |||
|0 | |||
| -10929 | |||
| -60 | |||
| -10553 | |||
|---- | |||
|0.5 (Median) | |||
|0 | |||
| -4876 | |||
|264 | |||
| -4560 | |||
|---- | |||
|0.75 | |||
|0 | |||
| -1567 | |||
|820 | |||
| -1307 | |||
|---- | |||
|0.95 | |||
|0 | |||
| -112 | |||
|2117 | |||
|147 | |||
|---- | |||
|0.975 | |||
|0 | |||
| -10 | |||
|2635 | |||
|459 | |||
|---- | |||
|0.99 | |||
|0 | |||
|14 | |||
|3180 | |||
|995 | |||
|---- | |||
|} | |||
[[Image:VOI analysis for farmed salmon.PNG]] | [[Image:VOI analysis for farmed salmon.PNG]] | ||
Revision as of 14:08, 27 December 2007
Scope
Purpose
The purpose of the assessment is to evaluate the recommendation given by Hites et al [1] that people should not eat farmed salmon too often because of the pollutant concentrations.
Boundaries
- Pollutants: Toxaphene, dieldrin, PCB
- Nutrients: Omega-3 fatty acids
- Health impacts:
- Total cancer caused by pollutants
- Cardiovascular deaths and the impact of omega-3 fatty acids
- Population: the population of Western Europe (European Economic Area as of beginning of 2004)
- Current situation (year 2004)
Scenarios
- Recommendation for not to eat farmed salmon too often (yes/no)
- Setting up new stricter regulations about pollutants in fish feed (yes/no)
Intended users
- The primary users are public health authorities and decision-makers involved in giving food recommendations.
- The secondary user group is the general public. Quantitative estimates are offered to increase understanding of the magnitudes of the related issues.
Participants
The assessment is restricted to a group of environmental health researchers. See participant list in Farmed salmon (project).
Definition
Analyses
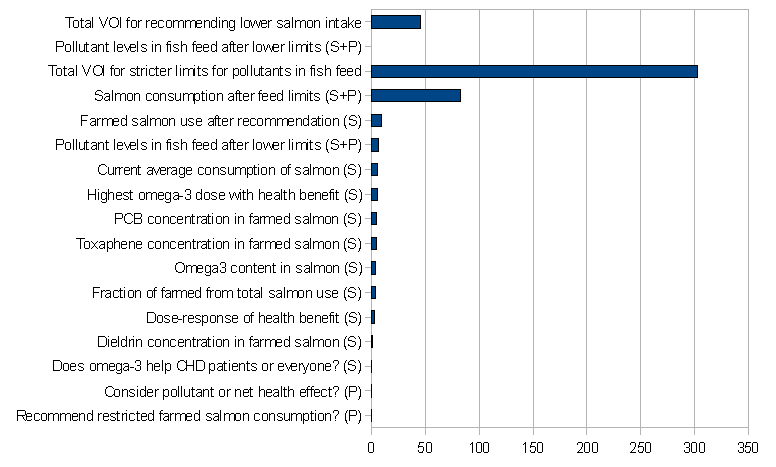
- Value of information analyses
- Outcome: Net health effect; Decision: Recommend restricted farmed salmon consumption?; Variables tested: all
- Outcome: Net health effect; Decision: Lower limits for pollutants in fish feed?; Variables tested: all
- Importance analyses
- Outcome: Mortality by recommendation; Variables tested: all
- Outcome: Mortality by feed regulation; Variables tested: all
Result
Results
The main results and conclusions have been published by Tuomisto et al.[2]
Table: Net health impacts of eating farmed salmon. The results include the health impacts of the total health impact of omega-3 intake from salmon.
| Statistics or fractile | Business as usual | Recommend restrictions | Stricker rules for feed | Both |
| Mean | 31062 | 22929 | 31428 | 23296 |
| SD | 22650 | 17105 | 22842 | 17317 |
| 0.01 | 576 | 404 | 653 | 460 |
| 0.025 | 1782 | 1286 | 1847 | 1356 |
| 0.05 | 3632 | 2697 | 3766 | 2803 |
| 0.25 | 14547 | 10590 | 14780 | 10793 |
| 0.5 (Median) | 25187 | 18504 | 25479 | 18829 |
| 0.75 | 43064 | 31526 | 43628 | 32091 |
| 0.95 | 76141 | 56697 | 77010 | 57393 |
| 0.975 | 88267 | 66397 | 89040 | 67249 |
| 0.99 | 101832 | 79328 | 102202 | 80143 |
Table: Net health impacts of eating farmed salmon compared with the business-as-usual scenario.
| Statistics or fractile | Business as usual | Recommend restrictions | Stricter rules for feed | Both |
| Mean | 0 | -8133 | 366 | -7766 |
| SD | 0 | 9703 | 982 | 9637 |
| 0.01 | 0 | -45895 | -2335 | -45557 |
| 0.025 | 0 | -35624 | -1662 | -35171 |
| 0.05 | 0 | -27745 | -1155 | -27041 |
| 0.25 | 0 | -10929 | -60 | -10553 |
| 0.5 (Median) | 0 | -4876 | 264 | -4560 |
| 0.75 | 0 | -1567 | 820 | -1307 |
| 0.95 | 0 | -112 | 2117 | 147 |
| 0.975 | 0 | -10 | 2635 | 459 |
| 0.99 | 0 | 14 | 3180 | 995 |
Conclusions
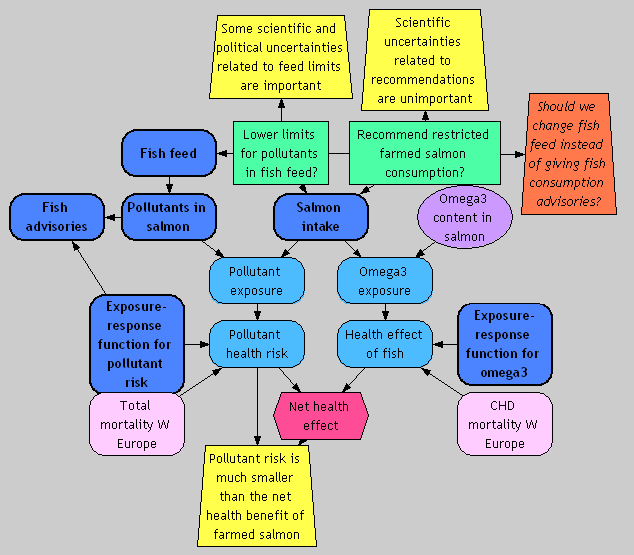
- Pollutant risk is much smaller than the net health benefit of farmed salmon
- Scientific uncertainties related to recommendations are unimportant
- Some scientific and political uncertainties related to feed limits are important
References
- ↑ Hites et al. Science 2004.
- ↑ Tuomisto JT, Tuomisto J, Tainio M, Niittynen M, Verkasalo P, Vartiainen T, Kiviranta H, Pekkanen J. Risk-benefit analysis of eating farmed salmon. Science. 2004 Jul 23;305(5683):476-7 Read the article


