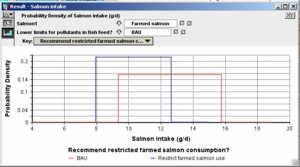
Salmon intake in the population of the Western Europe
| Moderator:Nobody (see all) Click here to sign up. |
|
|
| Upload data
|
Scope
Salmon intake in the population of the Western Europe describes intake of farmed and wild salmon after the two decisions (regulate fish feed pollutants / recommend restrictions for farmed salmon use) has been made. Although market salmon exists in the index, it is not used in this version of the model. Wild salmon use after restricting farmed salmon use has a triangular probability distribution. Min assumes the same relative decrease as in farmed salmon; mode assumes no change; max assumes that wild salmon intake increases so much that it totally compensates the decrease in farmed salmon use. Estimates are based on author judgement. The wild salmon production capacity is probably much smaller than the max used for the variable. This overestimation causes bias towards smaller costs due to salmon use restrictions.
Definition
Data
Data comes from EPIC study looking at fish consumption in 10 European countries by gender. We take the minimum, the unweighed average and the maximum of these values in the distribution to represent uncertainty in population average fatty fish intake:
<anacode>Triangular( 7.5, 15.3, 31 )</anacode>
All fatty fish is assumed to be salmon. [1]
Causality
Upstream variables
- Variable:Recommendation for consumption of farmed salmon
- Variable:Pollutant concentration limits for fish feed
Unit
g/d
Formula
See the Analytica model file for details.
<anacode>Table(Salmon,Reg_poll,Recommendation)( F,(A*F), (F+Pollutant_scare),((A*F)+Pollutant_scare), W,Triangular((A*W),W,(W+((1-A)*F))), W,Triangular((A*W),W,(W+((1-A)*F))), 0,0, 0,0 )</anacode>
Result

{{#opasnet_base_link:Op_en1904}}
| Statistics or fractile | Business as usual | Recommend restrictions | Stricter rules for feed | Both |
| Mean | 16.14 | 11.79 | 16.31 | 11.96 |
| SD | 4.53 | 3.62 | 4.55 | 3.64 |
| 0.01 | 7.84 | 7.48 | 7.87 | 7.19 |
| 0.025 | 8.55 | 7.56 | 8.68 | 7.5 |
| 0.05 | 9.38 | 7.69 | 9.49 | 7.78 |
| 0.25 | 12.74 | 8.93 | 12.91 | 9.11 |
| 0.5 (Median) | 15.66 | 10.85 | 15.83 | 11.04 |
| 0.75 | 19.25 | 13.77 | 19.44 | 13.96 |
| 0.95 | 24.22 | 19.09 | 24.41 | 19.29 |
| 0.975 | 25.57 | 20.93 | 25.75 | 21.11 |
| 0.99 | 27.01 | 22.69 | 27.2 | 22.87 |
See also
Assessments that use this variable:
- Benefit-risk assessment on farmed salmon
- {{#sql-query:
SELECT Var.Ident as Variable, Assessment.*, Assessment.page AS Link FROM Obj as Var, Item, Sett, Obj as Assessment WHERE Var.id = Item.Obj_id AND Item.Sett_id = Sett.id AND Sett.Obj_id = Assessment.id AND Sty_id = 3 AND Var.Ident = "Op_en1904" |Show the assessments that use this variable}}
References
- ↑ Welch AA, Lund E, Amiano P, Dorronsoro M. Variability in fish consumption in 10 European countries. In: Riboli E, Lambert R, editors. Nutrition and lifestyle: opportunities for cancer prevention. Lyon: International Agency for Research on Cancer, 2002: 221-222. PDF of article Data in Excel