Benefit-risk assessment of Baltic herring and salmon intake

![]() Assessment presentation ·
show ready-made model results (without salmon)
Assessment presentation ·
show ready-made model results (without salmon)
Scope
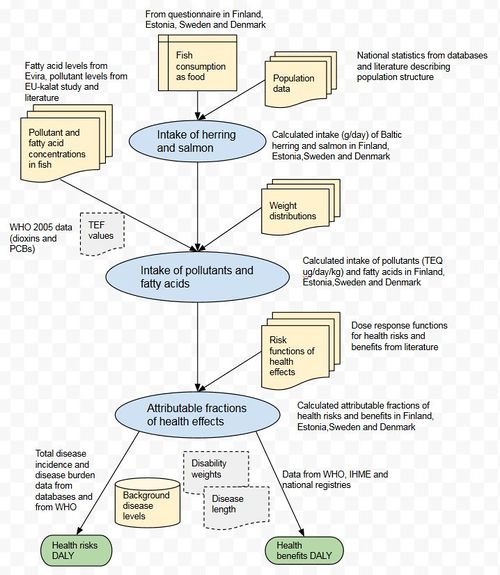
This assessment is part of the WP5 work in Goherr project. Purpose is to evaluate health benefits and risks caused of eating Baltic herring and salmon in four Baltic sea countries (Denmark, Estonia, Finland and Sweden). This assessment is currently on-going.
Question
What are the current population level health benefits and risks of eating Baltic herring and salmon in Finland, Estonia, Denmark and Sweden? How would the health effects change in the future, if consumption of Baltic herring and salmon changes due to actions caused by different management scenarios of Baltic sea fish stocks?
Intended use and users
Results of this assessment are used to inform policy makers about the health impacts of fish. Further, this assessment will be combined with the results of the other Goherr WPs to produce estimates of future health impacts of Baltic fish related to different policy options. Especially, results of this assessment will be used as input in the decision support model built in Goherr WP6.
Participants
- National institute for health and welfare (THL)
- Goherr project group
Boundaries
- Four baltic sea countries (Denmark, Estonia, Finland, Sweden)
- Current situation (fish use year 2016, pollutant levels in fish year 2010)
- Estimation for future (not year specific)
Decisions and scenarios
Management scenarios developed in Goherr WP3 frames the following boundaries to the use and consumption of Baltic herring and salmon as human food. Effect of these scenarios to the dioxin levels and the human food use will be evalauted quantitatively and feed into the health benefit-risk model to assess the health effect changes.
- Scenario 1: “Transformation to sustainability”
- Hazardous substances, including dioxins, are gradually flushed out and the dioxin levels in Baltic herring are below or close to the maximum allowable level.
- Fish stocks are allowed to recover to levels, which makes maximum sustainable yield possible and increases the total catches of wild caught fish. The catches of salmon by commercial fisheries has stabilized at low level, while the share of recreational catch increases slightly.
- The use of the Baltic herring catch for food increases. A regional proactive management plan for the use of catch has increased the capacity of the fishing fleets to fish herring for food and through product development and joint marketing, have increased consumer demand for Baltic herring.
- Scenario 2: “Business-as-usual”
- The commercial catches of salmon continue to decrease. The demand for top predatory species, such as salmon and cod remains high, while the demand for herring decreased further as a result of demographic changes.
- Most of the herring catch are used for fish meal and oil production in the region.
- The use of Baltic herring from the southern parts of the Baltic Sea where the dioxin contents are not likely to exceed the maximum allowable level, are prioritised for human consumption. In the absence of the demand in many of the Baltic Sea countries, majority of the herring intended for direct human consumption are exported to Russia.
- Scenario 3: “Inequality”
- The nutrient and dioxins levels continue to decrease slowly.
- The commercial catches of salmon have decreased further as the general attitudes favour recreational fishing, which has also resulted in decreased demand.
- The herring catches have increased slightly, but the availability of herring suitable for human consumption remains low due to both, dioxin levels that remain above the maximum allowable limit in the northern Baltic Sea and the poor capacity to fish for food.
- The use of the catch varies between countries. In Estonia, for example, where the whole catch has been traditionally used for human consumption, there is no significant change in this respect, but in Finland, Sweden and Denmark, herring fishing is predominantly feed directed.
- Scenario 4: “Transformation to protectionism”
- The level of hazardous substances also increases as emission sources are not adequately addressed.
- Commercial salmon fisheries disappears almost completely from the Baltic Sea, although restocking keeps small scale fisheries going.
- Many of the Baltic herring stocks are also fished above the maximum sustainable yield and total catches are declining.
- Owing to the growing dioxin levels detected in herring, majority of the catch is used for aquaculture.
Timing
- Model development during 2016 and 2017
- First set of results in March 2017, draft publication in March 2018
Answer
This section will be updated as soon as preliminary results are available
Results
Conclusions
Rationale
| [show] |
|---|


Stakeholders
- Policy makers
- Food safety authorities
- Fisheries management
- Researchers
- Food safety
- Health
- NGO's
- WWF
- Active consumers
- Marine Stewardship Council
- Baltic sea fishers and producers?
Dependencies
Calculation of cases of disease
- totcases (Op_en2261/totcases on page Health impact assessment) with dose and RR, automatic intermediate variables. Indices: Age, Gender, Country, Response.
- population, case-specific, from main model. Indices: Age, Gender, Country.
- disincidence,Incidence of the disease of interest. Op_en5917/initiate Disease risk. Indices: Age, Gender, Country, Response.
- ERF and threshold, exposure-response functions. Op_en2031/initiate Exposure-response function. Indices: Exposure_agent, Response, Exposure, Exposure_unit, ER_function, Scaling.
- frexposed, fraction of population that is exposed from Goherr: Fish consumption study. Indices: Age, Gender, Country.
- exposure, from the main model because has case-specific adjustments. Indices: Age, Gender, Country, Compound.
- amount, Consumption of fish. Indices: Gender, Age, Country, Fish.
- EU-kalat: concentration, Pollutant and fatty acid concentrations in fish. Indices: Fish_species → Fish, POP → Compound, Catch_square (Catch_site, Catch_location) → Area, Length_mean_mm → Length.
- Concentrations of beneficial nutrients in fish. Indices: Fish, Compound. ----#: . Good data for Baltic herring, Salmon not taken into account yet --Arja (talk) 13:27, 13 March 2017 (UTC) (type: truth; paradigms: science: comment) ←--#: . Take data from Fineli. --Jouni (talk) 16:03, 13 April 2017 (UTC) (type: truth; paradigms: science: defence) ----#: . Omega-3 content in salmon: update and change the answer to point to the main page. --Jouni (talk) 16:03, 13 April 2017 (UTC) (type: truth; paradigms: science: comment)
- Mercury concentrations in fish in Finland. Suggested indices: Fish, Location, Size, Year, Compound. ←--#: . update code by using Bayesian model on Kerty database. --Jouni (talk) 16:03, 13 April 2017 (UTC) (type: truth; paradigms: science: defence)
- Toxic equivalency factor (TEF). Indices: TEFversion, Compound. ←--#: . Done. --Jouni (talk) 14:22, 19 April 2017 (UTC) (type: truth; paradigms: science: defence)
Calculation of DALYs:
- totcases (see above)
- Disability weights of health effects
- Length of disease
| Obs | Decision maker | Decision | Option | Variable | Cell | Change | Result | Description |
|---|---|---|---|---|---|---|---|---|
| 1 | Food safety authority | Background | Yes | bgexposure | Identity | Consider background from other sources | ||
| 2 | Food safety authority | Background | No | bgexposure | Replace | 0 | Do not consider background from other sources |
| Obs | Country | Gender | Exposure_agent | Result | Unit | Description |
|---|---|---|---|---|---|---|
| 1 | FI | Male | Vitamin D | 11.7 | µg /d | Finriski 12 - 0.3 silakasta |
| 2 | SWE | Male | Vitamin D | 11.7 | µg /d | Finriski 12 - 0.3 silakasta |
| 3 | EST | Male | Vitamin D | 11.7 | µg /d | Finriski 12 - 0.3 silakasta |
| 4 | DK | Male | Vitamin D | 11.7 | µg /d | Finriski 12 - 0.3 silakasta |
| 5 | Female | Vitamin D | 8.5 | µg /d | Finriski 8.7 - 0.2 silakasta | |
| 6 | Male | EPA | 120 | mg /d | Finriski 125 - 4.6 silakasta | |
| 7 | Female | EPA | 96 | mg /d | Finriski 100 - 3.9 silakasta | |
| 8 | Male | DHA | 118 | mg /d | Finriski 125 - 6.7 silakasta | |
| 9 | Female | DHA | 94 | mg /d | Finriski 100 - 5.4 silakasta | |
| 10 | PCDDF | 0 | pg /d (TEQ) | |||
| 11 | PCB | 0 | pg /d (TEQ) | |||
| 12 | MeHg | 0 | µg /d | |||
| 13 | logTEQ | 0 | log(pg /g) |
| Obs | Exposure_agent | Resp | Response | ER_function | Scaling | Dummy |
|---|---|---|---|---|---|---|
| 1 | TEQ | Tooth defect | Yes or no dental defect | ERS | None | 1 |
| 2 | TEQ | Cancer | Cancer morbidity | CSF | BW | 1 |
| 3 | TEQ | Dioxin TDI | Dioxin recommendation tolerable daily intake | TDI | BW | 1 |
| 4 | DHA | Child's IQ | Loss in child's IQ points | ERS | None | 1 |
| 5 | Omega3 | Heart (CHD) | CHD2 mortality | Relative Hill | None | 1 |
| 6 | Omega3 | Stroke | Stroke mortality | Relative Hill | None | 1 |
| 7 | Vitamin D | Vitamin D intake | Vitamin D recommendation | Step | None | 1 |
| 8 | MeHg | Child's IQ | Loss in child's IQ points | ERS | BW | 1 |
| Obs | Resp | DALY | Description |
|---|---|---|---|
| 1 | Heart (CHD) | 5 - 15 | Assumes DW 1 and D 10 U 50% |
| 2 | Stroke | 5 - 15 | Assumes DW 1 and D 10 U 50 % |
| 3 | Tooth defect | 0 - 0.12 | DW 0.001 D 60 U 100 %. Or should we use this: Developmental defect: caries or missing tooth, 0.008 (0.003 - 0.017), Periodontitis weight from IHME. D: 1. U from IHME? |
| 4 | Cancer | 0 - 0.28 | DW 0.1 D 20, in addition loss of life expectancy 5 a. This comes from a lifetime exposure, so it is (linearly( assumed that 1/50 of this is caused by one-year exposure. U 100 % |
| 5 | Vitamin D intake | 0.0001 - 0.0101 | DW 0.001 D 1 U 101x. 1 if not met |
| 6 | Dioxin TDI | 0.0001 - 0.0101 | DW 0.001 D 1 U 101x. 1 if not met |
| 7 | Child's IQ | 0.0517 (0.03 - 0.0817) | Intellectual disability, mild (IQ<70): 0.031/IQ point (0.018-0.049) From IHME. D 50 U from IHME. |
- DW = disability weight
- D = duration (a)
- U = uncertainty
PCDD/F and PCB concentration distributions for each fish species and country are estimated in the following way:
Population data from Eurostat database
|
| ||||||||||||||||||||||||||||||||||||||||||||||||||||||||||||||||||||||||||||||||||||||||||||||||||||||||||||||||||||||||||||||||||||||||||||||||||||||||||||||||||||||||||||||||||||||||||||||||||||||||||||||||||||||
|
| ||||||||||||||||||||||||||||||||||||||||||||||||||||||||||||||||||||||||||||||||||||||||||||||||||||||||||||||||||||||||||||||||||||||||||||||||||||||||||||||||||||||||||||||||||||||||||||||||||||||||||||||||||||||
Analyses
Indices
- Country (Denmark, Estonia, Finland, Sweden)
- Year (current, future)
- Gender
- Age: 18-45 years or >45 years
- Fish species (Baltic herring, Baltic salmon)
- Health end-point, specified by name
- Compound: TEQ (PCDD/F and PCB), Vitamin D, Omega3 (includes EPA and DHA), MeHg
Calculations
This section will have the actual health benefit-risk model (schematically described in the above figure) written with R. The code will utilise all variables listed in the above Dependencies section. Model results are presented as tables and figures when those are available.
- 18.5.2017: Archived exposure model Op7748/exposure by Arja (used separate ovariables for salmon and herring) [1]
Health impact model (Monte Carlo)
- Model run 13.3.2017: a simple copy of op_fi:Silakan hyöty-riskiarvio [2]
- Model run 13.3.2017 with showLocations function [3]
- Model run 13.3.2017 produces totcases results but are not meaningful yet [4]
- Model run 14.3.2017 with exposure graph [5]
- Model run 14.3.2017 bugs not fixed [6]
- Model run 30.5.2017 [7]
- Model run 12.6.2017 with 2D Monte Carlo [8]
- Model run 8.9.2017 with known bugs fixed [9]
- Model run 6.10.2017: added updated mc2d function, better exposure$Exposure (To eater or To child), Background as marginal after mc2d, MeHg concentrations; bugs fixed with conc_mehg and IQ disabilityweight [10]
- Model run 6.10.2017: 1000 iterations [11]
- Model run 11.10.2017: country-specific concentrations [12]
- Model run 12.10.2017: Background bug fixed [13] objects.get("150780268107")
- Model run 12.10.2017: with marginal background and new Limit decision [14] objects.get("150783160307")
- Model run 19.10.2017: n = 2117 and mc2d$run2d = FALSE [15]
- Model run 27.10.2017: salmon removed from amount. [16]
- Model run 15.11.2017: salmon included [17]
- Model run 21.11.2017: using EU-kalat concentration model from May 2017 [18]
- Model run 22.11.2017: correcting for conc and Large herring, also debugged mc2d. [19]
⇤--#: . We must check that Baltic herring, Large herring and Small herring are used in all variables coherently. There may be problems in conc. --Jouni (talk) 09:39, 21 November 2017 (UTC) (type: truth; paradigms: science: attack)
- ----#: . This must be corrected back when the bayesian conc_pcddf works again. --Jouni (talk) 14:11, 22 November 2017 (UTC) (type: truth; paradigms: science: comment)
⇤--#: . Country, Ages, and Gender are marginals in both RR an casesabs although mc2dparam$run2d==FALSE. Yet, in casesabs all combinations have 2117 rows, while in RR all combinations have 80-190 rows and only the combinations Exposcen*Limit*Background*Resp have 2117 rows each. So, RR works as expected with run2d==FALSE but casesabs does not. What is wrong? --Jouni (talk) 14:11, 22 November 2017 (UTC) (type: truth; paradigms: science: attack)
Second part
- Model run 4.6.2017 [20]
- Model run 11.6.2017 with 2D Monte Carlo [21]
- Model run 6.10.2017 [22] barchart shows blocks wrong in Opasnet but correctly on own computer
- Model run 12.10.2017 [23]
- Model run 16.10.2017: ggplot objects stored [24]
- Model run 21.11.2017: plots stored [25]
←--#: . These are the equal sizes for different graphics settings. A typically good base_size is 24:
- Opasnet graphics
- png(width = 1024, height=768) # (in pixels)
- pdf(width = 14, height=10.5) # (in inches) --Jouni (talk) 15:52, 21 November 2017 (UTC) (type: truth; paradigms: science: defence)
Plot concentrations and survey
- Requires codes Op_en7748/bayes and indirectly Op_en7748/preprocess.
- Model run 1.3.2017 [26]
Interface for BBN model
Health risk-benefit assessment model (BRA) implemented on this page produces also data for the overall Goherr Bayesian belief network model (BBN). In brief, the models are built in a way that they share the important nodes. This section describes how data from BRA is managed to fit BBN.
Data files and indices needed:
- Consumer country (out.population from population)
- Country (DK, EST, FI, SWE): total population size for each country
- Consumer gender (out.population from population)
- Gender (Female, Male): gender-specific number of people for each country
- Consumer age group (out.population from population)
- Age (18-45, 45>): gender and age-specific number of people for each country
- Effect of improved information
- Human consumption of salmon (out.salmonintake from amount[Fish=="Salmon",])
- Country, age, and gender-specific consumption (g/day)
- The same with or without salmon recommendation policy given improved information (to be determined)
- Human consumption of herring: same as for salmon (out.herringintake from amount[Fish!="Salmon",])
- Omega3 intake from salmon and herring (mg/day) (out.omegaintake from exposure[Exposure_agent=="Omega3"&Background=="No",])
- Human intake of dioxin from herring (out.herringdioxinexp from amount * conc)
- Human intake of dioxin from salmon (out.salmondioxinexp from amount * conc)
- Dioxin intake total (out.dioxinintake from exposure[Exposure_agent=="TEQ",])
- Other intake of omega3 (out.omegatotal$Background from exposure[Exposure_agent=="Omega3",])
- Omega3 intake total (out.omegatotal from exposure[Exposure_agent=="Omega3",])
- Net burden of disease (out.BoD from BoD summed over Response)
References
Keywords
See also
- Risk and Benefit Assessment of Herring and Salmonid Fish from the Baltic Sea Area
- Swedish Market Basket 2010
- Riksmaten 2010
- Danskernes kostvaner 2011-2013
- Shared understanding of Goherr policy situation using RDF approach (a detail about Baltic herring) [27]


