Health effects of radon in Europe
| This page is a product of the EBoDE project. The final report of the EBoDE project has been published as a report in 2011[1] and also as web pages in Opasnet. These links lead to parts of the report.
EBoDE project: main page | overview | contributors | data overview | Parma meeting | abbreviations | all pages Methods: environmental burden of disease calculation | selection of exposures and health effects | data needed | impact calculation tool Health effects in Europe: benzene | dioxins | formaldehyde | lead | ozone | particulate matter | radon | second-hand smoke | transport noise | environmental burden of disease | results by country |
| [show] This page is a study.
The page identifier is Op_en5227 |
|---|

About radon
Radon is a short-lived radioactive gas that occurs naturally in soils and rocks. It is generated by the radioactive decay of uranium. Indoor radon concentrations differ based on the characteristics of the geological substrates beneath houses and the use of different building materials.
Exposure to radon can lead to lung cancer. Studies to estimate the risk of lung cancer associated with residential radon exposure have been conducted in many European countries (Lagarde et al. 1997, Bochicchio, 2005, 2008; Darby et al., 2005, 2006). Radon is classified by IARC as carcinogenic to humans (type 1, 1988) with genotoxic action. No safe level of exposure can be determined (WHO, 2000a). Besides lung cancer radon is not known to cause other health effects.
Radon has a synergistic effect with smoking. Epidemiological evidence suggests that the risk of simultaneous exposure to both tobacco smoke and radon is more than additive but that it may be less than multiplicative. [1]
Selected health endpoints and exposure-response functions
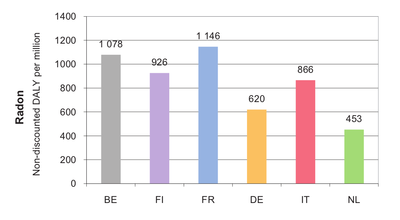
Radon effects are usually presented as additional cases of lung cancer at a certain exposure (i.e. unit risk model). In order to account for the interaction with smoking, however, a relative risk model seems more appropriate. We therefore calculated results using both a unit risk model and a relative risk model (method 1A and 2A). The RR method (1A) is used in the final aggregate results. The radon UR model (UR=6.6E-07 (Bq m-3)-1, Darby et al., 2005) is used for comparison of UR and RR modelling approaches in Chapter 5.
The relative risk model, as suggested by the meta-analysis of Darby et al. (2005), assumes the lung cancer risk from radon to be linearly proportional to the radon exposure, but also to the background lung cancer rate caused by tobacco smoking (and, to a lesser extent, by exposure to second-hand smoke, ambient air particulate matter and possibly some occupational exposures) (see Table 3-19 in section 3.12 for the RR values). [1]
Exposure data
The soil uranium contents and respectively the residential radon concentrations vary significantly between the countries. Yet the differences within the countries are still far greater, and the indoor radon concentrations in individual buildings are essentially impossible to predict. Long-term average indoor radon concentrations, however, are relatively easy to measure and are therefore better known and comparable between the countries than those of any other indoor air contaminant.
EBoDE uses the national residential radon exposure estimates as collected by the EU RadonMapping project (http://radonmapping.jrc.ec.europa.eu; country reports available from http://radonmapping.jrc.ec.europa.eu/index.php?id=37&no_cache=1&dlpath=National_Summary_Reports, accessed 11 June 2009). and the UNSCEAR 2000 Report, as presented in Table 3-14 and summarized in Table 3-21 in section 3.12. No further national data collection was conducted, but some additional international data sources were identified, notably from the WHO Radon project (IRP, 2010). [1]
| Country | AM
(Bq m-3) |
GM
(Bq m-3) |
GSD | % (of people exposed) › ≥200 Bq m-3 | % (of people exposed) › ≥400 Bq m-3 | Max
(Bq m-3) |
|---|---|---|---|---|---|---|
| Belgium | 69 | 76 | 2.0 | 0.5 | 4 500 | |
| Finland | 120 | 84 | 2.1 | 12.3 | 3.6 | 33 000 |
| France | 89 | 53 | 2.7 | 8.5 | 2.0 | 4 964 |
| Germany | 50 | 40 | 1.9 | 3.0 | 1.0 | 10 000 |
| Italy | 70 | 52 | 2.0 | 4.1 | 0.9 | 1 036 |
| The Netherlands | 30 | 25 | 1.6 | 0.3 | 0.0 | 382 |
AM: Arithmetic Mean; Bq: Becquerel; GM: Geometric Mean; GSD: Geometric Standard Deviation.
Uncertainties per stressor and comparison with other studies
A list of the most important sources of uncertainty for each stressor in the EBoDE calculations is provided in Table 5-1. Some of these are further explained below. In addition, we will compare our estimates to results of a selection of similar studies. Comparison of different studies on environmental burden of disease helps to understand the role of various methodological and strategic selections made in each study, like the selection of stressors or health endpoints.
Radon The exposure estimation and dose-response models are based on earlier international analysis conducted by Darby et al. (2006). In comparison with that the current work added estimation of the impacts in DALYs. Comparison of UR and RR models yielded similar results. The results using the RR approach, accounting for the national differences in the background rates of lung cancer, were selected for reporting. [1]
| Excluded health endpoints and related assumptions | Exposure data | Exposure response function | Calculation method | Level of overall uncertainty a) | Likely over- or underestimation b) | |
| Radon | No health endpoints excluded | Possible oversampling of geographical regions known problematic | * | No substantial error expected |
References
- ↑ Jump up to: 1.0 1.1 1.2 1.3 1.4 Otto Hänninen, Anne Knol: European Perspectives on Environmental Burden of Disease: Esimates for Nine Stressors in Six European Countries,
Authors and National Institute for Health and Welfare (THL), Report 1/2011 [1] [2] Cite error: Invalid
<ref>tag; name "EBoDe" defined multiple times with different content