Talk:Exposure of Finnish subpopulations to fine particles due domestic wood combustion
Jump to navigation
Jump to search
Is there any idea with preresults?
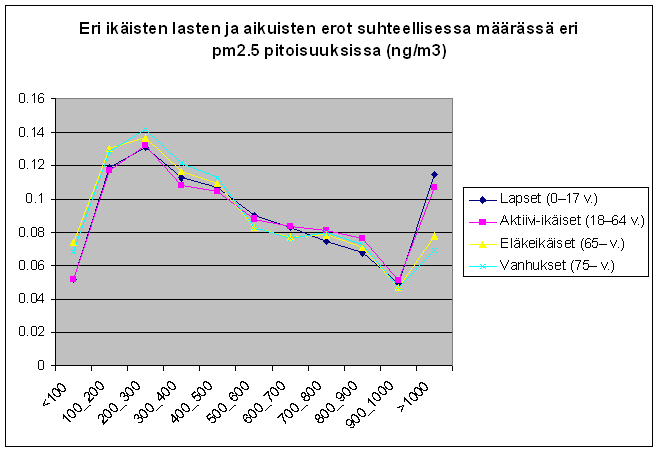
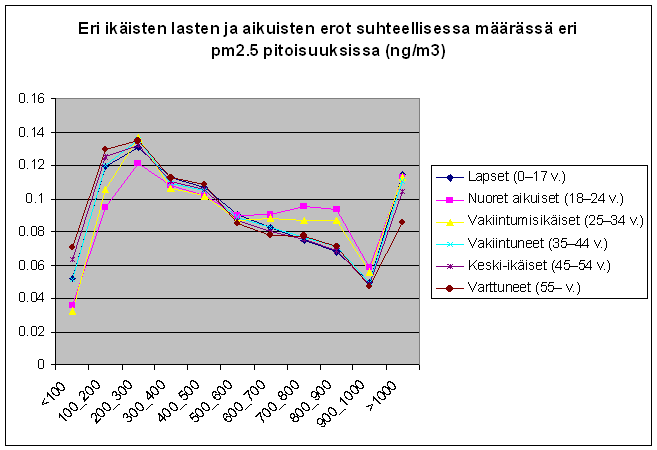
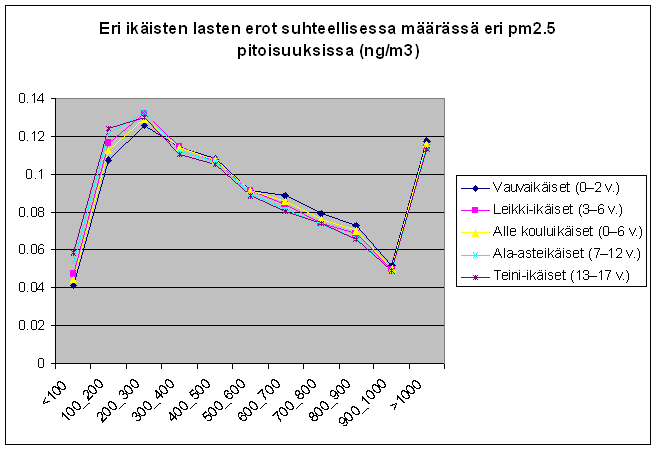
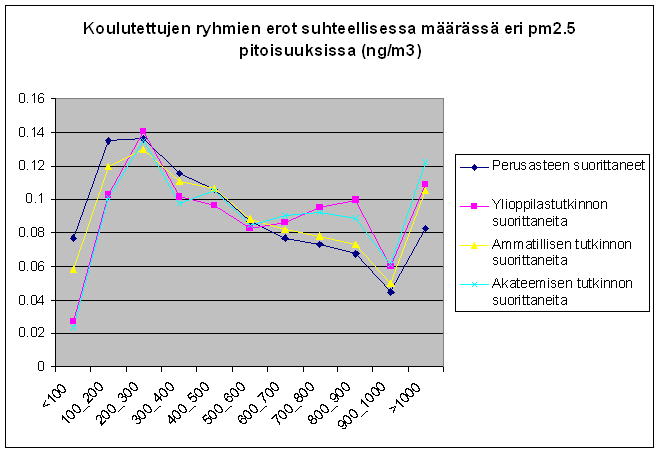
Eri pitoisuudet valittu ArcMapissa ja kunkin pitoisuus"luokan" väestö summattu yhteen R:llä. Kunkin väestöryhmän pitoisuus"luokan" summattu määrä on jaettu kyseisen väestöryhmän kokonaismäärällä (-> painotettu väestömäärä). Näistä painotetuista väestömääristä ("population ratio" tms??) on tehty kuvaajat eri ikäryhmittäin, koulutusryhmittäin jne. Alustavat tulokset siis tässä (HUOM! Kuvien otsikot on suosta revästy ja pitoisuudet tuisi olla mikroina):


←--#:: . There are some differences in figures 2 and 4, but are they meaningful? What I should be thinking of these results? --Pauliina 08:15, 4 May 2009 (EEST) (type: truth; paradigms: science: defence)