Drawing a causal diagram
| Moderator:Nobody (see all) Click here to sign up. |
|
|
| Upload data
|
Summary
Purpose
Drawing causal diagrams is about making graphs with nodes (variables) and arrows (causal links) with some explanatory text. D↷ With the help of causal diagram it is possible to clarify the aims, the key components and the structure of the assessment. The following types of contents should be described in the form of a causal digram:
- Key variables, i.e. the variables that are crucial for the assessment
- Indicators, i.e. the variables of most interest to the users of the outputs
- Endpoints of the assessment
- Decision variables
- Other variables needed to assess the other variables mentioned above
Structure of the process
Input format
Procedure
After the scoping and applying phases, there should be a good general level understanding of what is to be included in the assessment and what is to be excluded. Also, there should be a strong enough basis for identifying what are the endpoints of the assessment, what are the most important variables within the assessment scope in order to carry out the assessment successfully, what are the most interesting variables within the assessment scope from the point of view of the users and other audiences of the assessment output and what decision options are to be considered in the assessment. These overlapping sets of different variable types provide a good starting point for taking the first steps in carrying out the assessment work.
The identified variables are located along the source-impact chain fomring the skeleton of the causal diagram. The skeleton is then completed with necessary additional variables so that the whole source-impact chain is covered and all the variables included in the assessment are causally related, directly or indirectly, to the endpoints.
Management
Output format
At this point there should be a complete tentative causal network diagram covering the whole source-impact chain and including about all of the variables that are seen necessary to estimate within the assessment. It is, however, enough to have identified the names and tentative scopes of variables and have statements of the existence of causal relations between all the variables. This is, in essence, the description of the Definition attribute of the assessment.
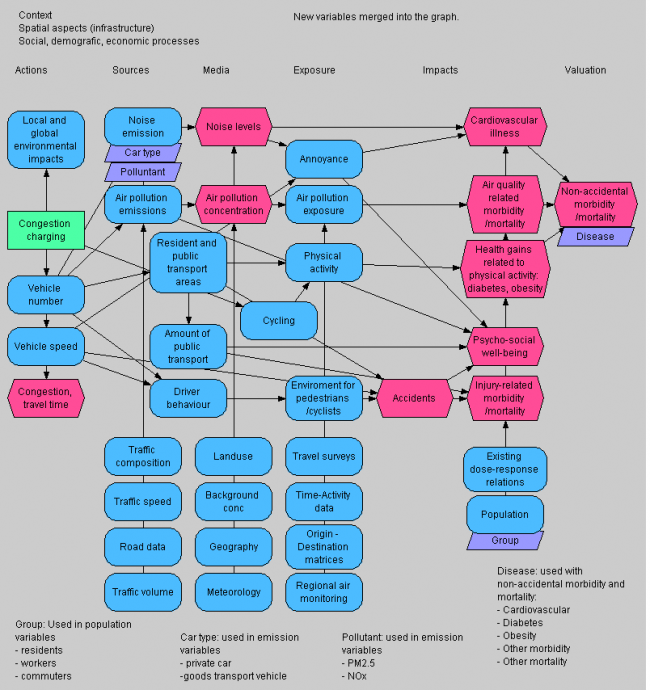
The causal diagram is a graphical representation of the risk assessment situation. Variables and their relations form the diagram. The diagram provides a graphical summary of the assessment and helps the assessors in identification of the issues to be assessed and targeting their work during the later phases of the assessment.
Below is an example of a complex causal diagram. The green rectangle is a decision variable; purple hexagons are indicators; and blue nodes are other variables. The variables are roughly located along the source-impact chain, with the steps along the chain described on the top of the figure.
