Building stock in Helsinki
| Moderator:Jouni (see all) |
|
|
| Upload data
|
- During Decision analysis and risk management 2015 course, this page was used to collect student contributions. To see them, look at an archived version. The page has since been updated for its main use. Data in the archived tables was moved: Table 2. Energy parametres of buildings, Table 4. Energy sinks, Table 5. Changes in energy efficiency, Table 6. Important energy parametres. Tables 3, 7, and 8 did not contain data and were removed.
Question
What is the building stock in Helsinki and its projected future?
Answer
Rationale
Data
Building stock
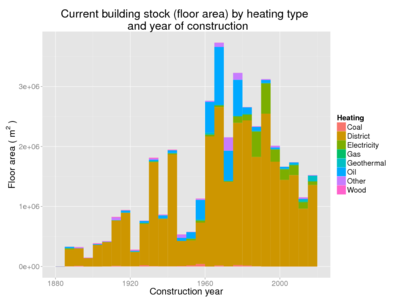
These tables are based on FACTA database classifications and their interpretation for assessments. This data is used for modelling. The data is large and can be seen from {{#opasnet_base_link:Op_en7115}}
(Stock details). Technical parts on this page are hidden for readability. Building types should match Energy use of buildings#Baseline energy consumption.
| Show details | ||||||||||||||||||||||||||||||||||||||||||||||||||||||||||||||||||||||||||||||||||||||||||||||||||||||||||||||||||||||||||||||||||||||||||||||||||||||||||||||||||||||||||||||||||||||||||||||||||||||||||||||||||||||||||||||||||||||||||||||||||||||||||||||||||||||||
|---|---|---|---|---|---|---|---|---|---|---|---|---|---|---|---|---|---|---|---|---|---|---|---|---|---|---|---|---|---|---|---|---|---|---|---|---|---|---|---|---|---|---|---|---|---|---|---|---|---|---|---|---|---|---|---|---|---|---|---|---|---|---|---|---|---|---|---|---|---|---|---|---|---|---|---|---|---|---|---|---|---|---|---|---|---|---|---|---|---|---|---|---|---|---|---|---|---|---|---|---|---|---|---|---|---|---|---|---|---|---|---|---|---|---|---|---|---|---|---|---|---|---|---|---|---|---|---|---|---|---|---|---|---|---|---|---|---|---|---|---|---|---|---|---|---|---|---|---|---|---|---|---|---|---|---|---|---|---|---|---|---|---|---|---|---|---|---|---|---|---|---|---|---|---|---|---|---|---|---|---|---|---|---|---|---|---|---|---|---|---|---|---|---|---|---|---|---|---|---|---|---|---|---|---|---|---|---|---|---|---|---|---|---|---|---|---|---|---|---|---|---|---|---|---|---|---|---|---|---|---|---|---|---|---|---|---|---|---|---|---|---|---|---|---|---|---|---|---|---|---|---|---|---|---|---|---|---|---|---|---|---|---|---|---|
|
The structures of the tables are based on CyPT Excel file N:\YMAL\Projects\ilmastotiekartta\Helsinki Data Input Template - Building Data.xlsx.
| Building | Baseline | 2020 | 2025 | 2050 | Year of baseline | Description |
| Residential | 27884795 | 32472388 | 34890241 | 44069914 | 2014 | Building stock of Helsinki area, 2014 |
| Public | 4537025 | 4764475 | 4945952 | 5855546 | 2014 | Building stock of Helsinki area, 2014 |
| Industrial | 3277271 | 3306063 | 3360467 | 3640854 | 2014 | Building stock of Helsinki area, 2014 |
| Other | 10861972 | 11406505 | 11840973 | 13806423 | 2014 | Building stock of Helsinki area, 2014 |
- Notes
- Estimates were based on
 Siemens City Performance toolin seuraava kokous 2.2 and some derived calculations on
  BUILDING STOCK CALCULATION 2015.
 - How to get the numbers for the baseline floor area for residential, public, industrial and other: Residential floor area was named as residential together, public by summing the floor area of health care, education and common buildings, industrial buildings were as such and other buildings comprise of business, traffic, office and storage buildings.
- Ref. Helsinki master plan for 2050: there are 860 000 citizens living in Helsinki (ref. www.yleiskaava.fi, visio2050); Residental buildings => fast growth
- Prediction of citizen number in Helsinki in 2020, 2030, 2040 and 2050 was used for calculations (ref. Helsingin 30% päästövähennysselvitys).
- Helsinki’s climate policy: 30% reduction in emissions: In 2010 the proportion of jobs in services and public sectors was 94%, and in industry 6%. In 2020 the proportion of jobs in services and public sectors is estimated to be 96%, and in industry 4%. Public and other buildings => between fast growth option and basic option, Industry=> Basic option
- Prediction of job number in Helsinki in 2020, 2030, 2040 and 2050 was used for calculations (ref. Helsingin 30% päästövähennysselvitys).
 Tables one and two The presentation of Tables 1 and 2
- Estimates for floor area development are asked from Alpo Tani (KSV) and Olli-Pekka Pietiläinen (SYKE) as well (26.5.). No answers yet.
Technical notes:
- Sheet 4_Input Buildings (Area Demand). Priority 1. Auxiliaries PPT. Absolute increase/decrease rate will be based on the inhabitants projected in time.
- This is another list building types that was considered but rejected as too complex: Residential buildings, Government & public administration buildings, Commercial offices buildings, Data centers buildings, Education and K12 and universitiy buildings, Hospitals and healthcare buildings, Hotels and hospitality and leisure buildings, Exhibitions and fairs and halls buildings, Retail and stores and shops buildings, Warehouses & shopping mall buildings, Industrial buildings, Non residential buildings unspecified.
Construction and demolition
It is assumed that construction equals 2 % of the existing building stock per year. All new buildings are assumed to be energy efficiency "New". It is assumed that no demolition occurs.
Renovations
Estimates from Laura Perez and Stephan Trüeb, unibas.ch N:\YMAL\Projects\Urgenche\WP9 Basel\Energy_scenarios_Basel_update.docx
| Obs | Age | Result | Description |
|---|---|---|---|
| 1 | 0 | 0 | Estimates from Laura Perez and Stephan Trüeb |
| 2 | 20 | 0 | Assumption Result applies to buildings older than the value in the Age column. |
| 3 | 25 | 1 | |
| 4 | 30 | 1 | |
| 5 | 50 | 1 | |
| 6 | 100 | 1 | |
| 7 | 1000 | 1 |
⇤--#: . Basel's data --Heta (talk) 12:30, 4 June 2015 (UTC) (type: truth; paradigms: science: attack)
| Obs | Renovation | Fraction | Description |
|---|---|---|---|
| 1 | None | 0 | |
| 2 | Windows | 65 | |
| 3 | Technical systems | 30 | |
| 4 | Sheath reform | 5 | |
| 5 | General | 0 |
⇤--#: . Basel's data --Heta (talk) 12:30, 4 June 2015 (UTC) (type: truth; paradigms: science: attack)
Locations of city areas
- Locations of city areas (hidden for readability).
| Show details | |||||||||||||||||||||||||||||||||||||||||||||||||||||||||||||||||||||||||||||||||||||||||||||||||||||||||||||||||||||||||||||||||||||||||||||||||||||||||||||||||||||||||||||||||||||||||||||||||||||||||||||||||||||||||||||||||||||||||||||||||||||||||||||||||||||||||||||||||||||||||||||||||||||||||||||||||||||||||||||||||||||||||||||||||||||||||||||||||||||||||||||||||||||||||||||||||||||||||||||||||||||||||||||||||||||||||||||||||||||||||||||||||||||||||||||||||||||||||||||||||||||||||||||||||||||||||||||||||||
|---|---|---|---|---|---|---|---|---|---|---|---|---|---|---|---|---|---|---|---|---|---|---|---|---|---|---|---|---|---|---|---|---|---|---|---|---|---|---|---|---|---|---|---|---|---|---|---|---|---|---|---|---|---|---|---|---|---|---|---|---|---|---|---|---|---|---|---|---|---|---|---|---|---|---|---|---|---|---|---|---|---|---|---|---|---|---|---|---|---|---|---|---|---|---|---|---|---|---|---|---|---|---|---|---|---|---|---|---|---|---|---|---|---|---|---|---|---|---|---|---|---|---|---|---|---|---|---|---|---|---|---|---|---|---|---|---|---|---|---|---|---|---|---|---|---|---|---|---|---|---|---|---|---|---|---|---|---|---|---|---|---|---|---|---|---|---|---|---|---|---|---|---|---|---|---|---|---|---|---|---|---|---|---|---|---|---|---|---|---|---|---|---|---|---|---|---|---|---|---|---|---|---|---|---|---|---|---|---|---|---|---|---|---|---|---|---|---|---|---|---|---|---|---|---|---|---|---|---|---|---|---|---|---|---|---|---|---|---|---|---|---|---|---|---|---|---|---|---|---|---|---|---|---|---|---|---|---|---|---|---|---|---|---|---|---|---|---|---|---|---|---|---|---|---|---|---|---|---|---|---|---|---|---|---|---|---|---|---|---|---|---|---|---|---|---|---|---|---|---|---|---|---|---|---|---|---|---|---|---|---|---|---|---|---|---|---|---|---|---|---|---|---|---|---|---|---|---|---|---|---|---|---|---|---|---|---|---|---|---|---|---|---|---|---|---|---|---|---|---|---|---|---|---|---|---|---|---|---|---|---|---|---|---|---|---|---|---|---|---|---|---|---|---|---|---|---|---|---|---|---|---|---|---|---|---|---|---|---|---|---|---|---|---|---|---|---|---|---|---|---|---|---|---|---|---|---|---|---|---|---|---|---|---|---|---|---|---|---|---|---|---|---|---|---|---|---|---|---|---|---|---|---|---|---|---|---|---|---|---|---|---|---|---|---|---|---|---|---|---|---|---|---|---|---|---|---|---|---|---|---|---|---|---|---|---|---|---|---|---|---|---|---|---|---|---|---|---|---|---|---|---|---|---|---|---|---|---|---|---|---|---|---|---|---|---|---|---|---|---|---|---|---|---|---|---|---|---|---|---|---|---|---|---|---|---|
|
The positions listed here are used for exposure modelling. Area code matches with stock detail data on Building stock in Helsinki. The coordinates should be visually checked from http://www.karttapaikka.fi referencing picture X.
|
See also
- Descriptions about the summary calculations on sheet Parameter Balance (not needed any more).
- Rakennustietoruudukko pääkaupunkiseudulta [1]
- Unit heat consumption of buildings in Finland
- Sitra, page 25
- Tee parannus pages 8-9, also 40-45
- VTT tiedotteet page 20-21, also 30, 80
- Heating consumption of buildings
References
