Birth defects
| Moderator:Teemu R (see all) |
|
|
| Upload data
|
Scope
What is the prevalence of birth defects in the general population?
Definition
| Rate (age, sex ratio) | Context (population size studied, location, date data taken, end-point measured) | Definition of end-point | Reference | |
|---|---|---|---|---|
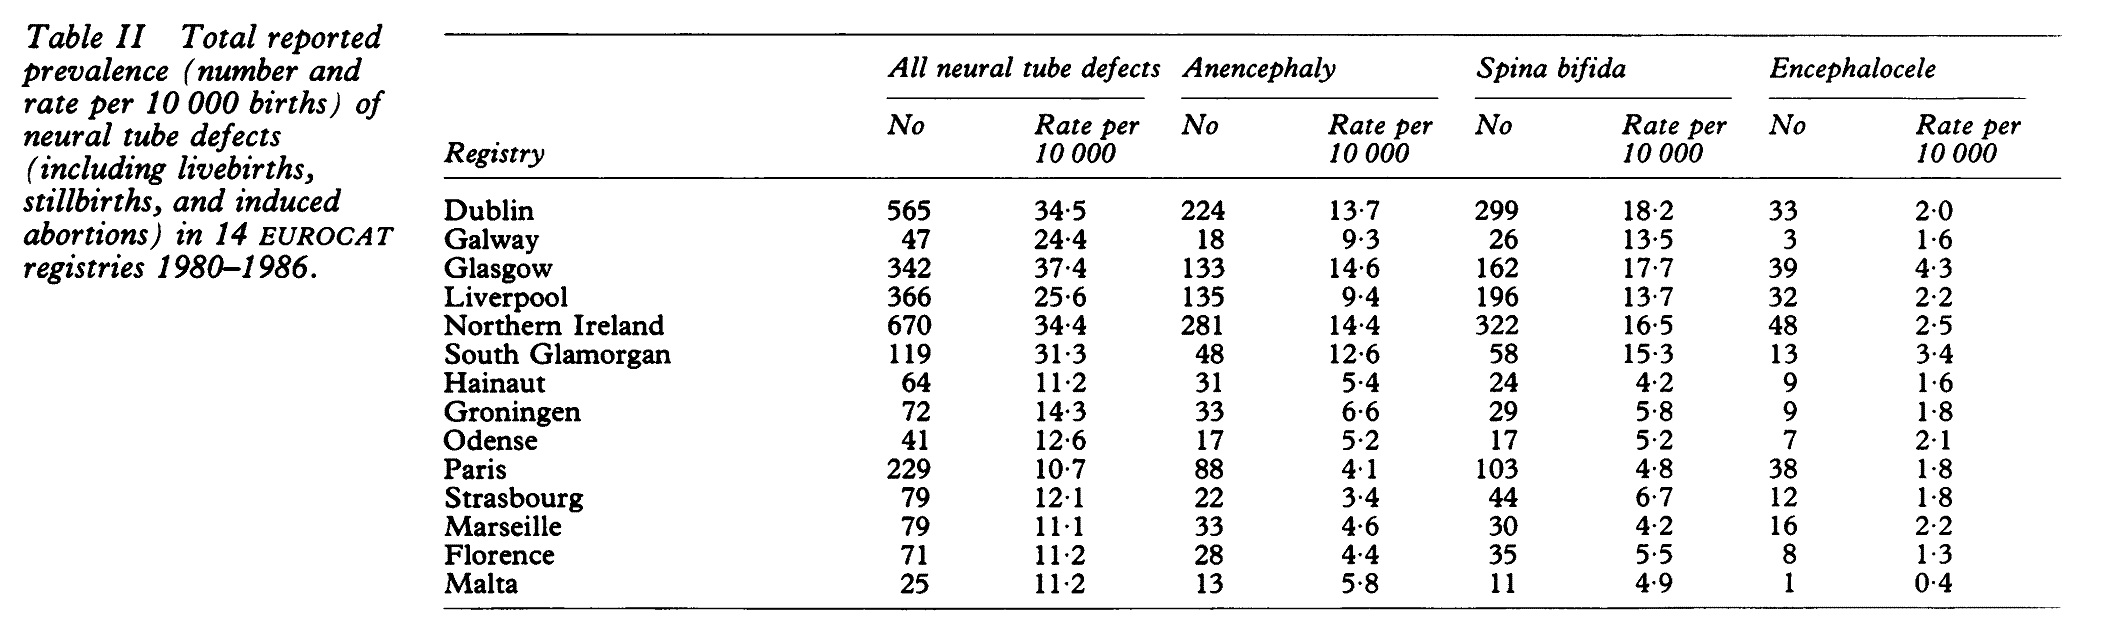
| Media:EUROCAT_neural_tube birth_defects.gif | Total reported prevalence (number and rate per 10 000 births) of neural tube defects including livebirths, stillbirths and induced abortions in 14 EUROCAT registries 1980-1986 | EUROCAT working group. Prevalence of neural tube defects in 20 regions of Europe and the impact of prenatal diagnosis, 1980- 1986. Journal of Epidemiology and Community Health 1991; 45: 52-58: | ||
| Tables can be created based on the surveillance data collected from 1980 to 2007 by 45 EUROCAT Registries, where you select the registries, years, and congenital anomalies. See hyperlink. | ||||
| See attached word document for cases and prevalence (per 10,000 births) for All Full Member Registries From 2000 – 2007. | European wide, 2000-2007, prevalence per 10 000 births | |||
| http://www.eurocat.ulster.ac.uk/pubdata/tables.html | ||||
| Annual birth coverage is 23.4% of births of the EU-15 countries, 35.0% of the EU-NMS countries and 25.6% of EU-27. | ||||
| Total prevalence of major congenital anomalies of 23.8 per | ||||
| 1,000 births for 2000-2004. | ||||
| Live birth prevalence (per 1,000 births) of: | ||||
| congenital heart disease = 6.1 | ||||
| Down Syndrome = 2.2 | ||||
| Cleft palate and lip = 1.3 | ||||
| Gastroschisis = 0.2 | ||||
| Hypospadias = 1.3 | European wide (38 registries in 20 countries covering 1.4 million births per year), 2000-2004, per 1,000 births | http://www.eurocat.ulster.ac.uk/pdf/Special-Report-Con-Malfs.pdf | ||
| Countries | 2004 | 2005 | 2006 | 2007 |
| Albania | 643.86 | ... | 952.09 | 1013.18 |
| Armenia | 1575.16 | 1501.37 | 1329.01 | 1471.14 |
| Austria | 382.43 | 383.68 | 345.25 | 308.2 |
| Azerbaijan | 487.81 | 480.62 | 450.5 | 472.48 |
| Belarus | 2234.02 | 2210.85 | 2308.7 | 2084.42 |
| Belgium | 2920.83 | 2394.03 | 2230.97 | ... |
| Bulgaria | 1409.44 | 1076.33 | 721.84 | 579.97 |
| Croatia | 1756.52 | 1673.26 | 1848.19 | ... |
| Czech Republic | 3757.78 | 3722.69 | 3566.06 | ... |
| Denmark | 6972.71 | 7230.64 | 7243.32 | 7618.36 |
| Estonia | 2437.11 | 2466.9 | 3313.84 | 3645.01 |
| Finland | 3161.47 | 3858.34 | 3788.24 | ... |
| Georgia | 649.08 | 699.67 | 687.48 | 588.16 |
| Hungary | 5203.02 | 5456.63 | 5777.45 | ... |
| Israel | 1659.01 | 1841.39 | 1602.89 | 1499.22 |
| Italy | 527.73 | 541.31 | ... | ... |
| Kazakhstan | 1478.24 | 1429.51 | 1302.05 | 1253.25 |
| Kyrgyzstan | 1114.25 | 1242.73 | 572.32 | 557.4 |
| Latvia | 599.36 | 640.76 | 502.24 | 446.77 |
| Lithuania | 4612.25 | 3984.81 | 3751.8 | 3382.18 |
| Malta | 3627.48 | 3240.02 | 2731.96 | ... |
| Montenegro | 573.32 | 625.68 | 411.63 | 306.36 |
| Netherlands | 2434.96 | 2648.08 | ... | ... |
| Norway | 5724.22 | ... | ... | ... |
| Republic of Moldova | 2090.3 | 1687.23 | 2120.41 | 1566.9 |
| Romania | 4482.55 | ... | ... | ... |
| Serbia | 514.16 | 1478.25 | 1400.06 | 883.97 |
| Slovakia | 2593.63 | 2612.53 | 2714.08 | 2429.08 |
| Switzerland | 4396.43 | 4885.94 | ... | ... |
| Turkmenistan | 443.94 | ... | 353.14 | ... |
| Ukraine | 2221.6 | 2228.66 | 2169.79 | ... |
| Uzbekistan | 643.81 | 578.22 | 572.09 | 565.39 |
| European Region | 2171.35 | 2186.96 | 2146.71 | ... |
| EU | 2645.55 | 2655.5 | ... | ... |
| EU members since 2004 or 2007 | 3774.85 | 3733.5 | 3715.88 | 3648.4 |
| CIS | 2013.04 | 1991.19 | 1940.7 | 1896.23 |
| CARK | 902.17 | 867.68 | 762.09 | ... |
| Eur-B+C | 2185.27 | 2187.79 | 2147.06 | 2089.6 |
| EU, 2004-2007 congenital anomalies per 100 000 live births | WHO European Health for All Database |
Result
{{#opasnet_base_link:Op_en4528}}
See also
Related files
<mfanonymousfilelist></mfanonymousfilelist>