Estimating traffic volumes for IEHIAS
- The text on this page is taken from an equivalent page of the IEHIAS-project.
In order to simulate the volume of waste and number of trucks moving along each route, the model has to be able to sum the number of vehicles as they converge on individual road segments (see Figure below). This is done in the ArcGIS9.3 raster environment, together with Excel. For this purpose, the shapefile delimiting the shortest path between each origin and destination has to be converted into a raster format, by intersecting it with a pre-prepared rectangular polygon file of the required resolution (e.g. 100x100m).
Worked example
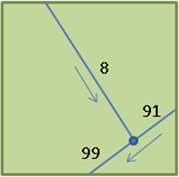
The image below shows the intersect between the shortest path shapefile and the polygon file for a single cell. In this example, routes from respectively 8 and 91 households converge onto one road (summed to 99 households) towards the waste management facility.
The intersected shapefile is then exported into Excel where the following calculations are performed:

| Nr of hh | Waste transported1 | Truck flow2 | |
| Households | Tonnes / y | Trucks/y one direction | Trucks/y two directions |
| 8 | 11.6 | 1.5 | 2.9 |
| 91 | 132.3 | 16.5 | 33.1 |
| 99 | 143.9 | 18.0 | 36.0 |
- 1.Amount of waste transported is calculated as the number households multiplied by the average annual tonnes of waste produced per household (in this case 1.454 tonnes/year)
- 2. Truck flow is calculated as the waste transported divided by the average truck capacity (tonnes): in this case 8 tonnes/truck.
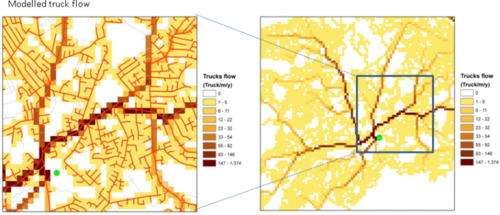
Figure 1 shows the modelled routes and the associated modelled truck flows
