Building stock in Helsinki: Difference between revisions
| (90 intermediate revisions by 7 users not shown) | |||
| Line 1: | Line 1: | ||
<noinclude> | |||
[[Category:Helsinki]] | [[Category:Helsinki]] | ||
[[Category:Buildings]] | [[Category:Buildings]] | ||
{{variable|moderator=Jouni}} | {{variable|moderator=Jouni}} | ||
:''During [[Decision analysis and risk management 2015]] course, this page was used to collect student contributions. To see them, look at [http://en.opasnet.org/en-opwiki/index.php?title=Building_stock_in_Helsinki&oldid=37151 an archived version]. The page has since been updated for its main use. Data in the archived tables was moved: [[Helsinki energy consumption#Energy parametres of buildings| Table 2. Energy parametres of buildings]], [[Helsinki energy consumption#Energy demand|Table 4. Energy sinks]], [[Helsinki energy consumption#Energy demand| Table 5. Changes in energy efficiency]], [[Helsinki energy consumption#Heating parametres of buildings|Table 6. Important energy parametres]]. Tables 3, 7, and 8 did not contain data and were removed. | |||
</noinclude> | |||
== Question == | == Question == | ||
What is the building stock in Helsinki and | What is the building stock in Helsinki and its projected future? | ||
== Answer == | == Answer == | ||
<gallery widths="400px" heights="350px"> | |||
File:Current building stock in Helsinki.png|Current building stock in Helsinki by heating type. | |||
File:Building stock in Helsinki by heating.png|Projected building stock based on 2015 data and urban plans. | |||
</gallery> | |||
<rcode embed=1 graphics=1> | |||
## This code is Op_en7115/ on page [[Building stock in Helsinki]]. | |||
library(OpasnetUtils) | |||
library(ggplot2) | |||
= | objects.latest("Op_en7115", code_name = "stockBuildings") | ||
* [[ | stockBuildings <- EvalOutput(stockBuildings) | ||
ggplot(stockBuildings@output, aes(x = Time, weight = stockBuildingsResult, fill = Heating)) + | |||
geom_bar(binwidth = 5) + theme_gray(base_size = 24) + | |||
labs( | |||
title = "Current building stock (floor area) by heating type \n and year of construction", | |||
x = "Construction year", | |||
y = expression("Floor area ( "*m^2*" )")) | |||
ggplot(stockBuildings@output, aes(x = Time, weight = stockBuildingsResult, fill = Building)) + | |||
geom_bar(binwidth = 5) + theme_gray(base_size = 24) + | |||
labs( | |||
title = "Current building stock (floor area) by building type \n and year of construction", | |||
x = "Construction year", | |||
y = expression("Floor area ( "*m^2*" )")) | |||
</rcode> | |||
== Rationale == | |||
This part contains the data needed for calculations about the building stock in Helsinki. It shows the different building and heating types in Helsinki, and how much and what kind of renovations are done for the existing building stock in a year, including how much and how old building stock is demolished. This data is used in further calculations in the model. | |||
There is also some other important data that wasn't used in the model's calculations. These include more accurate renovation statistics for residential buildings, U-value changes for renovations and thermal transmittance of different parts of residential buildings. This data is found under [[Building stock in Helsinki#Data not used|Data not used]]. | |||
=== Carbon neutral Helsinki 2035 === | |||
<rcode label="Push indicators to HNH2035 (for developers only)" embed=1> | |||
# This is code Op_en/7115 on page [[Building stock in Helsinki]] | |||
library(OpasnetUtils) | |||
library(plotly) | |||
objects.latest("Op_en6007", code_name = "miscellaneous") # [[OpasnetUtils/Drafts]] truncateIndex | |||
objects.latest("Op_en6007", code_name = "hnh2035") # [[OpasnetUtils/Drafts]] pushIndicatorGraph | |||
objects.latest("Op_en7237", code_name = "intermediates") # [[Helsinki energy decision 2015]] buildings etc. | |||
buildings <- EvalOutput(buildings) | |||
tmp <- truncateIndex(buildings,"Building",6) | |||
colnames(tmp@output)[colnames(tmp@output)=="EnergySavingPolicy"] <- "Scenario" | |||
#> unique(tmp$Scenario) | |||
#[1] BAU Energy saving moderate Energy saving total | |||
#[4] WWF energy saving | |||
levels(tmp$Scenario) <- c("BAU","NA","tavoite","NA") | |||
tmp <- tmp[tmp$Scenario!="NA",] | |||
p_buildings_b <- plot_ly( | |||
oapply(tmp[tmp$Scenario=="BAU",], c("Building","Time"),sum)@output, | |||
x = ~Time, y = ~buildingsResult, color = ~Building, | |||
type = 'scatter', mode = 'lines') %>% | |||
layout( | |||
title="Rakennusala talotyypeittäin", | |||
xaxis=list(title="Vuosi"), | |||
yaxis=list(title="Rakennusala (m2)") | |||
) | |||
p_buildings_h <- plot_ly( | |||
oapply(tmp[tmp$Scenario=="BAU",], c("Heating","Time"),sum)@output, | |||
x = ~Time, y = ~buildingsResult, color = ~Heating, | |||
type = 'scatter', mode = 'lines') %>% | |||
layout( | |||
title="Rakennusala lämmitysmuodoittain", | |||
xaxis=list(title="Vuosi"), | |||
yaxis=list(title="Rakennusala (m2)") | |||
) | |||
pushIndicatorGraph(p_buildings_b, "https://hnh.teamy.fi/v1/indicator/12/") | |||
pushIndicatorGraph(p_buildings_h, "https://hnh.teamy.fi/v1/indicator/13/") | |||
</rcode> | |||
=== Building stock === | |||
'''These tables are based on FACTA database classifications and their interpretation for assessments. | |||
This data is used for modelling. The data is large and can be seen from [http://en.opasnet.org/w/Special:Opasnet_Base?id=Op_en7115.stock_details the Opasnet Base]. Technical parts on this page are hidden for readability. Building types should match [[Energy use of buildings#Baseline energy consumption]]. | |||
{{hidden| | |||
<t2b name="Building types" index="Building types in Facta" obs="Building" desc="Number of the class" unit="-"> | |||
Yhden asunnon talot|Detached and semi-detached houses|11 | |||
Kahden asunnon talot|Detached and semi-detached houses|12 | |||
Muut erilliset pientalot|Detached and semi-detached houses|13 | |||
Rivitalot|Attached houses|21 | |||
Ketjutalot|Attached houses|22 | |||
Luhtitalot|Blocks of flats|32 | |||
Muut asuinkerrostalot|Blocks of flats|39 | |||
Vapaa-ajan asuinrakennukset|Free-time residential buildings|41 | |||
Myymälähallit|Commercial|111 | |||
Liike- ja tavaratalot, kauppakeskukset|Commercial|112 | |||
Myymälärakennukset|Commercial|119 | |||
Hotellit, motellit, matkustajakodit, kylpylähotellit|Commercial|121 | |||
Loma-, lepo- ja virkistyskodit|Commercial|123 | |||
Vuokrattavat lomamökit ja osakkeet (liiketoiminnallisesti)|Commercial|124 | |||
Muut majoitusliikerakennukset|Commercial|129 | |||
Asuntolat, vanhusten palvelutalot, asuntolahotellit|Commercial|131 | |||
Muut asuntolarakennukset|Commercial|139 | |||
Ravintolat, ruokalat ja baarit|Commercial|141 | |||
Toimistorakennukset|Offices|15 | |||
Toimistorakennukset|Offices|151 | |||
Rautatie- ja linja-autoasemat, lento- ja satamaterminaalit|Transport and communications buildings|161 | |||
Kulkuneuvojen suoja- ja huoltorakennukset|Transport and communications buildings|162 | |||
Pysäköintitalot|Transport and communications buildings|163 | |||
Tietoliikenteen rakennukset|Transport and communications buildings|164 | |||
Muut liikenteen rakennukset|Transport and communications buildings|169 | |||
Keskussairaalat|Buildings for institutional care|211 | |||
Muut sairaalat|Buildings for institutional care|213 | |||
Terveyskeskukset|Buildings for institutional care|214 | |||
Terveydenhuollon erityislaitokset|Buildings for institutional care|215 | |||
Muut terveydenhuoltorakennukset|Buildings for institutional care|219 | |||
Vanhainkodit|Buildings for institutional care|221 | |||
Lasten- ja koulukodit|Buildings for institutional care|222 | |||
Kehitysvammaisten hoitolaitokset|Buildings for institutional care|223 | |||
Muut huoltolaitosrakennukset|Buildings for institutional care|229 | |||
Lasten päiväkodit|Buildings for institutional care|231 | |||
Muualla luokittelemattomat sosiaalitoimen rakennukset|Buildings for institutional care|239 | |||
Vankilat|Buildings for institutional care|241 | |||
Teatterit, konsertti- ja kongressitalot, oopperat|Assembly buildings|311 | |||
Elokuvateatterit|Assembly buildings|312 | |||
Kirjastot ja arkistot|Assembly buildings|322 | |||
Museot ja taidegalleriat|Assembly buildings|323 | |||
Näyttelyhallit|Assembly buildings|324 | |||
Seurain-, nuoriso- yms. talot|Assembly buildings|331 | |||
Kirkot, kappelit, luostarit, rukoushuoneet|Assembly buildings|341 | |||
Seurakuntatalot|Assembly buildings|342 | |||
Muut uskonnollisten yhteisöjen rakennukset|Assembly buildings|349 | |||
Jäähallit|Assembly buildings|351 | |||
Uimahallit|Assembly buildings|352 | |||
Tennis-, squash- ja sulkapallohallit|Assembly buildings|353 | |||
Monitoimihallit ja muut urheiluhallit|Assembly buildings|354 | |||
Muut urheilu- ja kuntoilurakennukset|Assembly buildings|359 | |||
Muut kokoontumisrakennukset|Assembly buildings|369 | |||
Peruskoulut, lukiot ja muut|Educational buildings|511 | |||
Ammatillisten oppilaitosten rakennukset|Educational buildings|521 | |||
Korkeakoulurakennukset|Educational buildings|531 | |||
Tutkimuslaitosrakennukset|Educational buildings|532 | |||
Järjestöjen, liittojen, työnantajien yms. opetusrakennukset|Educational buildings|541 | |||
Muualla luokittelemattomat opetusrakennukset|Educational buildings|549 | |||
Voimalaitosrakennukset|Industrial buildings|611 | |||
Yhdyskuntatekniikan rakennukset|Industrial buildings|613 | |||
Teollisuushallit|Industrial buildings|691 | |||
Teollisuus- ja pienteollisuustalot|Industrial buildings|692 | |||
Muut teollisuuden tuotantorakennukset|Industrial buildings|699 | |||
Teollisuusvarastot|Warehouses|711 | |||
Kauppavarastot|Warehouses|712 | |||
Muut varastorakennukset|Warehouses|719 | |||
Paloasemat|Fire fighting and rescue service buildings|721 | |||
Väestönsuojat|Fire fighting and rescue service buildings|722 | |||
Muut palo- ja pelastustoimen rakennukset|Fire fighting and rescue service buildings|729 | |||
Navetat, sikalat, kanalat yms.|Agricultural buildings|811 | |||
Eläinsuojat, ravihevostallit, maneesit|Agricultural buildings|819 | |||
Viljankuivaamot ja viljan säilytysrakennukset|Agricultural buildings|891 | |||
Kasvihuoneet|Agricultural buildings|892 | |||
Turkistarhat|Agricultural buildings|893 | |||
Muut maa-, metsä- ja kalatalouden rakennukset|Agricultural buildings|899 | |||
Saunarakennukset|Other buildings|931 | |||
Talousrakennukset|Other buildings|941 | |||
Muualla luokittelemattomat rakennukset|Other buildings|999 | |||
Ammatilliset oppilaitokset|Educational buildings| | |||
Kirjastot|Other buildings| | |||
Lastenkodit, koulukodit|Other buildings| | |||
Loma- lepo- ja virkistyskodit|Other buildings| | |||
Monitoimi- ja muut urheiluhallit|Other buildings| | |||
Museot, taidegalleriat|Assembly buildings| | |||
Muut kerrostalot|Blocks of flats| | |||
Muut majoitusrakennukset|Commercial| | |||
Muut terveydenhoitorakennukset|Buildings for institutional care| | |||
Terveydenhoidon erityislaitokset (mm. kuntoutuslaitokset)|Buildings for institutional care| | |||
Vapaa-ajan asunnot|Free-time residential buildings| | |||
Viljankuivaamot ja viljan säilytysrakennukset, siilot|Warehouses| | |||
</t2b> | |||
{{comment|# |Viimeiset 12 riviä (ilman numeroa) ovat tyyppejä jotka ovat datassa (tai ainakin vanhassa taulukossa) mutta puuttuvat Sonjan luokittelusta.|--[[User:Jouni|Jouni]] ([[User talk:Jouni|talk]]) 12:57, 24 August 2015 (UTC)}} | |||
==== | For residential buildings (classes A and B) the classification is kept more detailed than for other buildings. This is because residential buildings are the biggest energy consumers in Helsinki and different classes of residential buildings are examined separately.<br /> | ||
Reference for the classification: http://www.stat.fi/meta/luokitukset/rakennus/001-1994/koko_luokitus.html | |||
<t2b name="Heating types" index="Heating types in Facta" obs="Heating" unit="-"> | |||
|Other | |||
Kauko- tai aluelämpö|District heating | |||
Kevyt polttoöljy|Light oil | |||
Kivihiili, koksi tms.|Coal | |||
Maalämpö tms.|Geothermal | |||
Puu|Wood | |||
Raskas polttoöljy|Fuel oil | |||
Sähkö|Electricity | |||
Kaasu|Gas | |||
Muu|Other | |||
</t2b> | |||
The structures of the tables are based on CyPT Excel file N:\YMAL\Projects\ilmastotiekartta\Helsinki Data Input Template - Building Data.xlsx. | The structures of the tables are based on CyPT Excel file N:\YMAL\Projects\ilmastotiekartta\Helsinki Data Input Template - Building Data.xlsx. | ||
}} | |||
<rcode name="stockBuildings" label="Initiate stockBuildings (developers only)" embed=1 store=1> | |||
library(OpasnetUtils) | |||
library(ggplot2) | |||
< | # [[Building stock in Helsinki]], building stock, locations by city area (in A Finnish coordinate system) | ||
#stockBuildings <- Ovariable("stockBuildings", ddata = "Op_en7115.stock_details") | |||
#colnames(stockBuildings@data)[colnames(stockBuildings@data) == "Built"] <- "Time" | |||
#colnames(stockBuildings@data)[colnames(stockBuildings@data) == "Postal code"] <- "City_area" | |||
< | # [[Building stock in Helsinki]] | ||
dat <- opbase.data("Op_en7115.stock_details")[ , c( | |||
# "Rakennus ID", | |||
"Sijainti", | |||
"Valmistumisaika", | |||
# "Julkisivumateriaali", | |||
"Käyttötarkoitus", | |||
# "Lämmitystapa", | |||
"Polttoaine", | |||
# "Rakennusaine", | |||
# "Varusteena koneellinen ilmanvaihto", | |||
# "Perusparannus", | |||
# "Kunta rakennuttajana", | |||
# "Energiatehokkuusluokka", | |||
# "Varusteena aurinkopaneeli", | |||
"Tilavuus", | |||
"Kokonaisala", | |||
"Result" # Kerrosala m2 | |||
)] | |||
colnames(dat) <- c("City_area", "Time", "Building types in Facta", "Heating types in Facta", "Tilavuus", "Kokonaisala", "Kerrosala") | |||
dat$Time <- as.numeric(substring(dat$Time, nchar(as.character(dat$Time)) - 3)) | |||
#dat <- dat[dat$Time != 2015 , ] # This is used to compare numbers to 2014 statistics. | |||
dat$Time <- as.numeric(as.character((cut(dat$Time, breaks = c(0, 1885 + 0:26*5), labels = as.character(1885 + 0:26*5))))) | |||
dat$Tilavuus <- as.numeric(as.character(dat$Tilavuus)) | |||
dat$Kokonaisala <- as.numeric(as.character(dat$Kokonaisala)) | |||
dat$Kerrosala <- as.numeric(as.character(dat$Kerrosala)) | |||
build <- tidy(opbase.data("Op_en7115.building_types")) | |||
colnames(build)[colnames(build) == "Result"] <- "Building" | |||
heat <- tidy(opbase.data("Op_en7115.heating_types")) | |||
colnames(heat)[colnames(heat) == "Result"] <- "Heating" | |||
###################### | |||
# Korjaus | |||
######################## | |||
temp <- as.character(heat$Heating) | |||
temp[temp == "District heating"] <- "District" | |||
temp[temp == "Light oil"] <- "Oil" | |||
temp[temp == "Fuel oil"] <- "Oil" | |||
< | heat$Heating <- temp | ||
# | ######################################## | ||
# | |||
dat <- merge(merge(dat, build), heat)#[c("City_area", "Time", "Building", "Heating", "stockBuildingsResult")] | |||
dat$Kerrosala[is.na(dat$Kerrosala)] <- dat$Kokonaisala[is.na(dat$Kerrosala)] * 0.8 # If floor area is missing, estimate from total area. | |||
cat("Kerrosala ilman 2015 (m^2)\n") | |||
oprint(aggregate(dat["Kerrosala"], by = dat["Building"], FUN = sum, na.rm = TRUE)) | |||
cat("Kokonaisala ilman 2015 (m^2)\n") | |||
oprint(aggregate(dat["Kokonaisala"], by = dat["Building"], FUN = sum, na.rm = TRUE)) | |||
cat("Tilavuus ilman 2015 (m^3)\n") | |||
oprint(aggregate(dat["Tilavuus"], by = dat["Building"], FUN = sum, na.rm = TRUE)) | |||
temp <- aggregate(dat["Kerrosala"], by = dat[c("Time", "Building", "Heating")], FUN =sum, na.rm = TRUE) | |||
colnames(temp)[colnames(temp) == "Kerrosala"] <- "stockBuildingsResult" | |||
stockBuildings <- Ovariable("stockBuildings", data = temp) | |||
objects.store(stockBuildings) | |||
cat("Ovariable stockBuildings stored.\n") | |||
</rcode> | |||
=== Construction and demolition === | |||
It is assumed that construction occurs at a constant rate so that there is an increase of 42% in 2050 compared to 2013. Energy efficiency comes from [[Energy use of buildings]]. | |||
<rcode name="changeBuildings" label="Initiate changeBuildings (for developers only)" embed=1> | |||
# This code is Op_en7115/changeBuildings on page [[Building stock in Helsinki]] | |||
library(OpasnetUtils) | |||
changeBuildings <- Ovariable("changeBuildings", | |||
dependencies = data.frame( | |||
Name = c( | |||
"stockBuildings", | |||
"efficiencyShares" | |||
), | |||
Ident = c( | |||
"Op_en7115/stockBuildings", # [[Building stock in Helsinki]] | |||
"Op_en5488/efficiencyShares" # [[Energy use of buildings]] | |||
) | |||
), | |||
formula = function(...) { | |||
out <- oapply(stockBuildings, cols = c("Time", "Constructed"), FUN = sum) | |||
out <- out * 0.013125 * 5 * efficiencyShares # linear increase 42% from 2013 to 2050 | |||
out@output <- out@output[as.numeric(as.character(out@output$Time)) >= 2015 , ] | |||
return(out) | |||
} | |||
) | |||
objects.store(changeBuildings) | |||
cat("Ovariable changeBuildings stored.\n") | |||
</rcode> | |||
'''Fraction of houses demolished per year. | |||
<t2b name=" | <t2b name="Demolition rate" index = "Age" obs="Rate" unit="% /a"> | ||
0|0 | |||
50|1 | |||
1000|1 | |||
</t2b> | </t2b> | ||
<rcode name="demolitionRate" label="Initiate demolitionRate (for developers only)" embed=1> | |||
# This code is Op_en7115/demolitionRate on page [[Building stock in Helsinki]] | |||
library(OpasnetUtils) | |||
'' | demolitionRate <- Ovariable('demolitionRate', | ||
dependencies = data.frame(Name = "dummy"), | |||
formula = function(...) { | |||
temp <- tidy(opbase.data('Op_en7115', subset = 'Demolition rate')) | |||
temp$Age <- round(as.numeric(as.character(temp$Age))) | |||
out <- as.data.frame(approx( | |||
temp$Age, | |||
temp$Result, | |||
n = (max(temp$Age) - min(temp$Age) + 1), | |||
method = "constant" | |||
)) | |||
colnames(out) <- c("Age", "demolitionRateResult") | |||
out$demolitionRateResult <- out$demolitionRateResult / 100 * 10 # For ten-year intervals | |||
out <- Ovariable("demolitionRate", output = out, marginal = c(TRUE, FALSE)) | |||
return(out) | |||
} | |||
) | |||
objects.store(demolitionRate) | |||
cat("Object demolitionRate stored.\n") | |||
< | </rcode> | ||
=== Heating type conversion === | |||
The fraction of heating types in the building stock reflects the situation at the moment of construction and not currently. The heating type conversion corrects this by changing a fraction of heating methods to a different one at different timepoints. Cumulative fraction, other timepoints will be interpolated. | |||
<t2b name='Yearly_heating_converted_factor' index='Heating_from,Heating_to,Time' unit='m2/m2'> | |||
Oil|Geothermal|2005|0 | |||
Oil|Geothermal|2015|0.5 | |||
Oil|Geothermal|2025|1 | |||
</t2b> | </t2b> | ||
<rcode name="heatTypeConversion" label="Initiate heatTypeConversion(developers only)" embed=1> | |||
library(OpasnetUtils) | |||
heatTypeConversion <- Ovariable("heatTypeConversion", | |||
dependencies = data.frame( | |||
Name = c( | |||
"buil", # stock at different timepoints | |||
"obstime" | |||
) | |||
), | |||
formula = function(...) { | |||
dat <- opbase.data("Op_en7115", subset = "Yearly_heating_converted_factor") | |||
colnames(dat)[colnames(dat) == "Time"] <- "Obsyear" | |||
dat$Obs <- NULL | |||
out <- data.frame() | |||
temp <- unique(dat[c("Heating_from", "Heating_to")]) | |||
for (i in 1:nrow(temp)) { | |||
onetype <- merge(temp[i,], dat) | |||
tempout <- merge(obstime@output, onetype, all.x = TRUE)[c("Obsyear","Result")] | |||
tempout <- merge(tempout, temp[i,]) | |||
for (j in (1:nrow(tempout))[is.na(tempout$Result)]) { | |||
a <- onetype$Obsyear[which.min(abs(as.numeric(as.character(onetype$Obsyear)) - as.numeric(as.character(obstime$Obsyear[j]))))] | |||
tempout$Result[j] <- onetype$Result[a] | |||
} | |||
out <- rbind(out, tempout) | |||
} | |||
out <- Ovariable(output = out, marginal = colnames(out) != "Result") | |||
colnames(out@output)[colnames(out@output) == "Heating_from"] <- "Heating" | |||
out <- buil * out | |||
out1 <- out | |||
out1$Result <- - out1$Result | |||
out1$Heating_to <- NULL | |||
out$Heating <- out$Heating_to | |||
out$Heating_to <- NULL | |||
out@output <- rbind(out1@output, out@output) | |||
#sum(out$Result) | |||
#nrow(out1@output)*2 - nrow(out@output) | |||
return(out) | |||
} | |||
) | |||
objects.store(heatTypeConversion) | |||
cat("Ovariable heatTypeConversionstored.\n") | |||
</rcode> | |||
=== Renovations === | |||
Estimates from Laura Perez and Stephan Trüeb, unibas.ch N:\YMAL\Projects\Urgenche\WP9 Basel\Energy_scenarios_Basel_update.docx | |||
<t2b name= | <t2b name='Fraction of houses renovated per year' index="Age" obs="Result" desc="Description" unit= "%"> | ||
0|0|Estimates from Laura Perez and Stephan Trüeb | |||
20|0|Assumption Result applies to buildings older than the value in the Age column. | |||
25|1| | |||
30|1| | |||
50|1| | |||
100|1| | |||
1000|1| | |||
</t2b> | </t2b> | ||
<rcode name="renovationRate" label="Initiate renovationRate (developers only)" embed=1> | |||
library(OpasnetUtils) | |||
'' | renovationRate <- Ovariable('renovationRate', | ||
dependencies = data.frame(Name = "dummy"), | |||
formula = function(...) { | |||
temp <- tidy(opbase.data('Op_en7115', subset = 'Fraction of houses renovated per year')) | |||
temp$Age <- round(as.numeric(as.character(temp$Age))) | |||
out <- as.data.frame(approx( | |||
temp$Age, | |||
temp$Result, | |||
n = (max(temp$Age) - min(temp$Age) + 1), | |||
method = "constant" | |||
)) | |||
colnames(out) <- c("Age", "renovationRateResult") | |||
out$renovationRateResult <- out$renovationRateResult / 100 | |||
out <- Ovariable("renovationRate", output = out, marginal = c(TRUE, FALSE)) | |||
return(out) | |||
} | |||
) | |||
objects.store(renovationRate) | |||
cat("Object renovationRate stored.\n") | |||
</rcode> | |||
<t2b name= | <t2b name='Popularity of renovation types' index='Renovation' obs='Fraction' desc='Description' unit='%'> | ||
None|0| | |||
Windows|65| | |||
Technical systems|30| | |||
Sheath reform|5| | |||
General|0| | |||
</t2b> | </t2b> | ||
<rcode name="renovationShares" label="Initiate renovationShares (developers only)" embed=1> | |||
library(OpasnetUtils) | |||
renovationShares <- Ovariable("renovationShares", | |||
dependencies = data.frame(Name = "dummy"), | |||
formula = function(...) { | |||
out <- Ovariable("raw", ddata = 'Op_en7115', subset = 'Popularity of renovation types') | |||
out <- findrest((out), cols = "Renovation", total = 100) / 100 | |||
renovationyear <- Ovariable("renovationyear", data = data.frame( | |||
Obsyear = factor(c(2015, 2025, 2035, 2045, 2055, 2065)), | |||
Result = 1 | |||
)) | |||
out <- out * renovationyear # renovation shares repeated for every potential renovation year. | |||
out@output$Renovation <- factor(out@output$Renovation, levels = c( | |||
"None", | |||
"General", | |||
"Windows", | |||
"Technical systems", | |||
"Sheath reform" | |||
), ordered = TRUE) | |||
return(out) | |||
} | |||
) | |||
objects.store( | |||
renovationShares # Fraction of renovation type when renovation is done. | |||
) | |||
cat("Objects renovationShares stored.\n") | |||
=== | </rcode> | ||
<noinclude> | |||
=== Locations of city areas === | |||
;Locations of city areas (hidden for readability). | |||
{{hidden| | |||
The positions listed here are used for exposure modelling. Area code matches with stock detail data on [[Building stock in Helsinki]]. The coordinates should be visually checked from http://www.karttapaikka.fi referencing picture X. | |||
<t2b name=" | <t2b name="Locations of city areas" index="City_area,Area code,Location" locations="N,E" unit="epsg:ETRS-TM35FIN"> | ||
001|KRU|6672352|386953 | |||
002|KLU|6672912|385513 | |||
003|KAA|6671692|386153 | |||
004|KAM|6671692|385233 | |||
005|PUN|6671352|385113 | |||
006|E|6670792|385573 | |||
007|UL|6670372|385973 | |||
008|KAT|6671752|387933 | |||
009|KAI|6670632|387573 | |||
010|SÖR|6674072|387453 | |||
011|KAL|6673712|385933 | |||
012|ALP|6673712|385933 | |||
013|ETU|6672552|383733 | |||
014|TAK|6673472|384753 | |||
015|ARI|6673872|382813 | |||
016|RUS|6676072|383793 | |||
017|PAS|6676092|385093 | |||
018|LAA|6675052|384433 | |||
019|MUSKOR|6672592|388413 | |||
020|LÄN|6670552|384033 | |||
021|HER|6675432|387573 | |||
022|VAL|6674912|386573 | |||
023|TOU|6676272|387793 | |||
024|KUM|6676192|386593 | |||
025|KÄP|6676932|386153 | |||
026|KOS|6677812|387393 | |||
027|VAN|6676972|387933 | |||
028|OUL|6678952|386533 | |||
029|HAA|6678032|383353 | |||
030|MUN|6674752|381733 | |||
031|LAU|6670952|381593 | |||
032|KON|6679852|380593 | |||
033|KAA|6680752|382413 | |||
034|PAK|6680392|385993 | |||
035|TUO|6682492|385653 | |||
036|VII|6676912|389553 | |||
037|PUK|6680352|388573 | |||
038|MAL|6680252|390153 | |||
039|TAP|6682632|389273 | |||
040|SUUT|6684152|389693 | |||
041|SUUR|6682512|393113 | |||
042|KUL|6674292|389193 | |||
043|HER|6675272|391093 | |||
044|TAM|6674252|392653 | |||
045|VAR|6677372|394013 | |||
046|PIT|6678172|381453 | |||
047|MEL|6679192|394193 | |||
048|VAR|6672872|393793 | |||
049|LAA|6672072|391593 | |||
050|VIL|6670412|395553 | |||
051|SAN|6668612|392993 | |||
052|SUO|6668912|388813 | |||
053|ULK|6666992|395973 | |||
054|VUO|6675252|397553 | |||
055|ÖST|6681312|399633 | |||
056|SAL|6679252|3985130 | |||
057|TAL|6679452|400333 | |||
058|KAR|6680652|401453 | |||
059|ULT|6683472|400453 | |||
401||6684572|390899 | |||
402||6680780|382563 | |||
403||6677628|383571 | |||
404||6682460|385139 | |||
405||6675756|391603 | |||
406||6679980|391731 | |||
407||6679724|380771 | |||
408||6676828|387779 | |||
409||6673900|389379 | |||
410||6675708|386355 | |||
411||6678556|387027 | |||
412||6671724|392691 | |||
413||6674156|391539 | |||
414||6668124|381699 | |||
415||6673356|380707 | |||
417||6677388|399763 | |||
418||6680476|390883 | |||
419||6678956|395043 | |||
420||6676332|381987 | |||
421||6683244|385635 | |||
422||6678972|386803 | |||
423||6680252|385939 | |||
424||6679740|388819 | |||
425||6669196|391683 | |||
426||6683676|388515 | |||
427||6684108|389843 | |||
428||6678156|381315 | |||
429||6682524|391027 | |||
430||6672204|391459 | |||
431||6681740|386131 | |||
432||6672924|385635 | |||
433||6677196|394211 | |||
434||6678188|390147 | |||
435||6676380|397027 | |||
436||6676380|384755 | |||
437||6674156|383123 | |||
438||6682316|398147 | |||
439||6679612|400499 | |||
440||6684124|402355 | |||
441||6679724|399027 | |||
442||6682076|400499 | |||
878||6678380|390771 | |||
895||6678380|390771 | |||
</t2b> | </t2b> | ||
}} | |||
=== Data not used === | |||
This contains data that was not used in the model's calculations. This includes renovation rates, the rates of heat flowing out of buildings and total floor areas of multiple types of buildings in Helsinki. The floor area data is also found in the background data of this page, which was used in the model. | |||
{| {{prettytable}} | {| {{prettytable}} | ||
|+'' | |+'''Effective floor area of buildings by building type. | ||
|---- | |||
|| Building|| Baseline|| 2020|| 2025|| 2050|| Year of baseline|| Description | |||
|---- | |||
|| Residential|| 27884795|| 32472388|| 34890241|| 44069914|| 2014|| Building stock of Helsinki area, 2014 | |||
|---- | |---- | ||
| | || Public|| 4537025|| 4764475|| 4945952|| 5855546|| 2014|| Building stock of Helsinki area, 2014 | ||
|---- | |||
|| Industrial|| 3277271|| 3306063|| 3360467|| 3640854|| 2014|| Building stock of Helsinki area, 2014 | |||
|---- | |||
|| Other|| 10861972|| 11406505|| 11840973|| 13806423|| 2014|| Building stock of Helsinki area, 2014 | |||
|---- | |---- | ||
|} | |} | ||
=== | ;Notes: | ||
''' | * Estimates were based on {{#l:Siemens City Performance toolin seuraava kokous 2.2.pdf}} and some derived calculations on {{#l:BUILDING STOCK CALCULATION 2015.xlsx}}. | ||
* How to get the numbers for the ''baseline floor area'' for residential, public, industrial and other: Residential floor area was named as residential together, public by summing the floor area of health care, education and common buildings, industrial buildings were as such and other buildings comprise of business, traffic, office and storage buildings. | |||
* Ref. Helsinki master plan for 2050: there are 860 000 citizens living in Helsinki (ref. www.yleiskaava.fi, visio2050); Residental buildings => fast growth | |||
* Prediction of citizen number in Helsinki in 2020, 2030, 2040 and 2050 was used for calculations (ref. Helsingin 30% päästövähennysselvitys). | |||
* Helsinki’s climate policy: 30% reduction in emissions: In 2010 the proportion of jobs in services and public sectors was 94%, and in industry 6%. In 2020 the proportion of jobs in services and public sectors is estimated to be 96%, and in industry 4%. Public and other buildings => between fast growth option and basic option, Industry=> Basic option | |||
* Prediction of job number in Helsinki in 2020, 2030, 2040 and 2050 was used for calculations (ref. Helsingin 30% päästövähennysselvitys). | |||
* {{#l:Tables one and two.pdf}} The presentation of Tables 1 and 2 | |||
''Technical notes'': | |||
: Sheet 4_Input Buildings (Area Demand). Priority 1. Auxiliaries PPT. Absolute increase/decrease rate will be based on the inhabitants projected in time. | |||
: This is another list building types that was considered but rejected as too complex: Residential buildings, Government & public administration buildings, Commercial offices buildings, Data centers buildings, Education and K12 and universitiy buildings, Hospitals and healthcare buildings, Hotels and hospitality and leisure buildings, Exhibitions and fairs and halls buildings, Retail and stores and shops buildings, Warehouses & shopping mall buildings, Industrial buildings, Non residential buildings unspecified. | |||
* There was a problem with missing data. There is more than 400000 m^2 floor area that is missing; this is estimated from total area that is available for these buildings. For other buildings, there is more than 400000 m^2 total area missing from buildings where floor area is given. See statistical analysis [http://en.opasnet.org/en-opwiki/index.php?title=Special:RTools&id=026ekUv81jP0A6rI]. This was corrected by inputation so that is floor area was missing, 0.8*total_area was used instead [http://en.opasnet.org/en-opwiki/index.php?title=Special:RTools&id=oE7UXNQt3Izdo4tE]. | |||
{| {{prettytable}} | |||
|+ Renovations per year made in residental buildings owned by Helsinki city, by construction year of the buildings.<ref name="uarvo">[http://www.tut.fi/ee/en/Materiaali/HAESS_loppuraportti_TTY_14062010.pdf HAESS Final report], Tampere University of Technology, 2010</ref> | |||
|--- | |||
! Construction year !! Balcony glasses !! Windows !! Julkisivujen peruskorjaus !! Vesikattojen peruskojaus !! Lämmönvaihtimen uusiminen !! Patteriverkoston säätö !! Kylpyhuonekalusteiden vaihto !! Patteriventtiilien vaihto !! New balcony doors !! LTO-laitteen asennus !! Water consumption measurements | |||
|--- | |||
| -20 || 0,0 % || 1,1 % || 1,1 % || 1,1 % || 1,1 % || 1,1 % || 1,1 % || 1,1 % || 1,1 % || 1,1 % || 1,1 % | |||
|--- | |||
| 21-25 ||0,0 % || 10,3 % || 1,2 % || 11,1 % || 10,3 % || 10,3 % || 1,2 % || 10,3 % || 1,2 % || 10,3 % || 10,3 % | |||
|--- | |||
| 26-30 || 0,0 % || 0,0 % || 0,0 % || 0,0 % || 0,0 % || 0,0 % || 0,0 % || 0,0 % || 0,0 % || 9,5 % || 0,0 % | |||
|--- | |||
| 31-35 || 0,0 % || 0,0 % || 0,0 % || 0,0 % || 0,0 % || 0,0 % || 0,0 % || 0,0 % || 0,0 % || 0,0 % || 0,0 % | |||
|--- | |||
| 36-40 || 0,0 % || 0,0 % || 0,0 % || 0,0 % || 4,2 % || 4,2 % || 0,0 % || 0,0 % || 0,0 % || 4,2 % || 0,0 % | |||
|--- | |||
| 41-45 || 0,0 % || 16,7 % || 0,0 % || 16,7 % || 16,7 % || 16,7 % || 0,0 % || 16,7 % || 0,0 % || 16,7 % || 16,7 % | |||
|--- | |||
| 46-50 || 0,0 % || 5,2 % || 0,0 % || 7,4 % || 7,4 % || 7,4 % || 0,0 % || 7,4 % || 0,0 % || 5,2 % || 5,2 % | |||
|--- | |||
| 51-55 || 0,0 % || 11,3 % || 0,0 % || 8,8 % || 8,8 % || 8,8 % || 0,0 % || 8,8 % || 0,0 % || 8,8 % || 16,2 % | |||
|--- | |||
| 56-60 || 0,0 % || 5,4 % || 0,0 % || 4,9 % || 6,2 % || 7,1 % || 0,0 % || 6,2 % || 4,5 % || 4,5 % || 5,4 % | |||
|--- | |||
| 61-65 || 0,0 % || 1,5 % || 1,3 % || 0,8 % || 2,9 % || 2,4 % || 1,0 % || 2,4 % || 0,9 % || 0,9 % || 2,9 % | |||
|--- | |||
| 66-70 || 0,6 % || 2,9 % || 1,2 % || 2,8 % || 1,4 % || 2,3 % || 1,1 % || 1,1 % || 0,1 % || 1,1 % || 1,1 % | |||
|--- | |||
| 71-75 || 3,2 % || 3,1 % || 3,4 % || 2,9 % || 3,1 % || 2,6 % || 0,2 % || 1,1 % || 0,2 % || 0,2 % || 0,2 % | |||
|--- | |||
| 76-80 || 0,1 % || 2,7 % || 0,1 % || 0,7 % || 2,0 % || 1,7 % || 1,1 % || 1,2 % || 0,2 % || 0,4 % || 0,2 % | |||
|--- | |||
| 81-85 || 1,0 % || 2,8 % || 0,7 % || 2,3 % || 3,3 % || 4,8 % || 3,5 % || 0,0 % || 0,0 % || 0,0 % || 0,8 % | |||
|--- | |||
| 86-90 || 0,0 % || 1,3 % || 0,0 % || 2,1 % || 6,1 % || 1,6 % || 0,7 % || 1,8 % || 0,3 % || 0,3 % || 1,0 % | |||
|--- | |||
| 91-95 || 0,6 % || 0,3 % || 0,0 % || 3,9 % || 8,6 % || 1,9 % || 5,1 % || 0,8 % || 0,2 % || 0,0 % || 1,3 % | |||
|--- | |||
| 96-00 || 0,1 % || 0,0 % || 0,0 % || 0,6 % || 1,2 % || 1,0 % || 1,5 % || 1,0 % || 0,0 % || 0,0 % || 4,2 % | |||
|--- | |||
| 01-05 || 2,9 % || 0,0 % || 0,0 % || 0,0 % || 1,2 % || 1,0 % || 0,0 % || 1,0 % || 0,0 % || 0,0 % || 0,7 % | |||
|--- | |||
| 06-10 || 1,7 % || 0,0 % || 0,0 % || 0,0 % || 0,5 % || 0,5 % || 0,0 % || 0,5 % || 0,0 % || 0,0 % || 0,0 % | |||
|} | |||
{{defend|# |In the document there are similar tables for total renovations from 2010 onwards to years 2016, 2020 and 2050.|--[[User:Heta|Heta]] ([[User talk:Heta|talk]]) 09:28, 16 June 2015 (UTC)}} | |||
< | {| {{prettytable}} | ||
| | |+'''Toimenpiteiden vaikutukset yksittäisessä kohteessa ja toimenpiteisiin liittyviä huomautuksia.<ref name="uarvo"/> | ||
|--- | |||
! Action !! The feature in question !! Difference to before !! Unit !! Notes | |||
|--- | |||
| Glass for balconies || U-value for windows || -0,3 || W/m<sup>2</sup>,K || Säästö 1-4% rakennustasolla | |||
|-- | |||
| Changing the windows || U-value for windows || -1 || W/m<sup>2</sup>,K || Vanhoista osa kaksilasisia ja osa kolmilasisia. Uudes 1,0 W/m<sup>2</sup>,K tai alle | |||
|--- | |||
| Julkisivun peruskorjaus || U-value of walls || -0,2 || W/m<sup>2</sup>,K || U-arvo puolitetaan eli n. 100 mm lisäeristys | |||
|--- | |||
</ | | Vesikattojen peruskorjaus || Yläpohjan U-arvo || -0,15 || W/m<sup>2</sup>,K || Oletetaan 50% lisäeristys U-arvo puoleen eli n. 100 mm lisäerstys | ||
|--- | |||
| Balcony door change || U-value of doors || -0,5 || W/m<sup>2</sup>,K || Tiivistyminen tuo lisäsäästöä | |||
|} | |||
=== | {| {{prettytable}} | ||
|+'''Thermal transmittances of building components and air flow rates. Averaged values calculates from the detailed model are presented here.<ref>MK Mattinen, J Heljo, J Vihola, A Kurvinen, S Lehtoranta, A Nissinen: Modeling and visualisation of residential sector energy consumption and greenhouse gas emissions</ref> | |||
|--- | |||
|colspan="2" rowspan="2"| Construction decade ||colspan="5"| Thermal transmittance factors for building components (W/m2K) ||colspan="3"| Ventilation and leakage air rates (1/h) | |||
|--- | |||
| Floor || Roof || Walls || Windows || Outdoors || Supply air through the heat recovery unit || Supply air bypassing the heat recovery unit || Leakage air | |||
|--- | |||
|rowspan="3"| Before 1980 || Single family house || 0.52 || 0.32 || 0.54 || 2.14 || 1.18 || 0.30 || 0.05 || 0.20 | |||
|--- | |||
| Row house || 0.52 || 0.36 || 0.56 || 2.15 || 1.00 || 0.3 || 0.05 || 0.20 | |||
|--- | |||
| Apartment building || 0.59 || 0.37 || 0.61 || 2.18 || 1.40 || 0.37 || 0.00 || 0.10 | |||
|--- | |||
|rowspan="3"| 1980's || Single family house || 0.30 || 0.21 || 0.28 || 1.70 || 1.00 || 0.30 || 0.05 || 0.15 | |||
|--- | |||
| Row house || 0.32 || 0.22 || 0.30 || 1.70 || 1.00 || 0.30 || 0.05 || 0.15 | |||
|--- | |||
| Apartment building || 0.34 || 0.23 || 0.29 || 1.80 || 1.40 || 0.35 || 0.00 || 0.10 | |||
|--- | |||
|rowspan="3"| 1990's || Single family house || 0.25 || 0.20 || 0.25 || 1.70 || 1.00 || 0.30 || 0.05 || 0.15 | |||
|--- | |||
| Row house || 0.32 || 0.22 || 0.28 || 1.70 || 1.00 || 0.30 || 0.05 || 0.15 | |||
|--- | |||
| Apartment building || 0.332 || 0.22 || 0.28 || 1.75 || 1.40 || 0.38 || 0.00 || 0.10 | |||
|--- | |||
|rowspan="3"| 2000's || Single family house || 0.24 || 0.17 || 0.24 || 1.40 || 1.00 || 0.30 || 0.05 || 0.13 | |||
|--- | |||
| Row house || 0.28 || 0.18 || 0.26 || 1.50 || 1.00 || 0.45 || 0.05 || 0.15 | |||
|--- | |||
| Apartment building || 0.28 || 0.18 || 0.26 || 1.50 || 1.40 || 0.55 || 0.00 || 0.10 | |||
|--- | |||
|rowspan="3"| 2010's || Single family house || 0.16 || 0.09 || 0.17 || 1.00 || 1.00 || 0.30 || 0.05 || 0.10 | |||
|--- | |||
| Row house || 0.16 || 0.09 || 0.17 || 1.00 || 1.00 || 0.50 || 0.05 || 0.15 | |||
|--- | |||
| Apartment building || 0.16 || 0.09 || 0.17 || 1.00 || 1.00 || 0.60 || 0.00 || 0.10 | |||
|} | |||
== See also == | == See also == | ||
{{Helsinki energy decision 2015}} | |||
* [[Building stock in Helsinki metropolitan area]] | |||
* [http://en.opasnet.org/en-opwiki/index.php?title=Building_stock_in_Helsinki&oldid=35248#Calculations Descriptions about the summary calculations on sheet Parameter Balance] (not needed any more). | * [http://en.opasnet.org/en-opwiki/index.php?title=Building_stock_in_Helsinki&oldid=35248#Calculations Descriptions about the summary calculations on sheet Parameter Balance] (not needed any more). | ||
* [http://ptp.hel.fi/paikkatietohakemisto/?id=125 Rakennustietoruudukko pääkaupunkiseudulta] [https://www.hsy.fi/fi/asiantuntijalle/avoindata/Sivut/AvoinData.aspx?dataID=14] | * [http://ptp.hel.fi/paikkatietohakemisto/?id=125 Rakennustietoruudukko pääkaupunkiseudulta] [https://www.hsy.fi/fi/asiantuntijalle/avoindata/Sivut/AvoinData.aspx?dataID=14] | ||
* [[Unit heat consumption of buildings in Finland]] | |||
* [http://era17.fi/wp-content/uploads/2010/10/sitran_selvityksia_39.pdf Sitra, page 25] | |||
* [http://www.teeparannus.fi/attachements/2010-12-21T11-54-1114846.pdf Tee parannus pages 8-9, also 40-45] | |||
* [http://www.vtt.fi/inf/pdf/tiedotteet/2007/T2377.pdf VTT tiedotteet page 20-21, also 30, 80] | |||
* [[Heating consumption of buildings]] | |||
* [http://www.tut.fi/ee/Tutkimus/lammike.html Lämmitystapavalintojen kehitys] | |||
== References == | == References == | ||
| Line 334: | Line 778: | ||
== Related files == | == Related files == | ||
<!-- __OBI_TS:1431310608 --> | <!-- __OBI_TS:1431310608 --> | ||
</noinclude> | |||
Latest revision as of 08:47, 18 December 2018
| Moderator:Jouni (see all) |
|
|
| Upload data
|
- During Decision analysis and risk management 2015 course, this page was used to collect student contributions. To see them, look at an archived version. The page has since been updated for its main use. Data in the archived tables was moved: Table 2. Energy parametres of buildings, Table 4. Energy sinks, Table 5. Changes in energy efficiency, Table 6. Important energy parametres. Tables 3, 7, and 8 did not contain data and were removed.
Question
What is the building stock in Helsinki and its projected future?
Answer
-
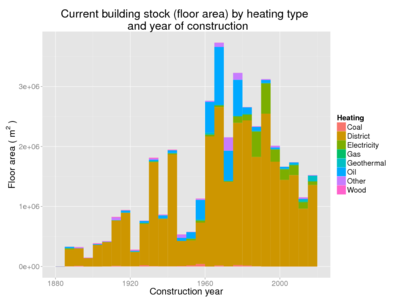
Current building stock in Helsinki by heating type.
-

Projected building stock based on 2015 data and urban plans.


Rationale
This part contains the data needed for calculations about the building stock in Helsinki. It shows the different building and heating types in Helsinki, and how much and what kind of renovations are done for the existing building stock in a year, including how much and how old building stock is demolished. This data is used in further calculations in the model.
There is also some other important data that wasn't used in the model's calculations. These include more accurate renovation statistics for residential buildings, U-value changes for renovations and thermal transmittance of different parts of residential buildings. This data is found under Data not used.
Carbon neutral Helsinki 2035
Building stock
These tables are based on FACTA database classifications and their interpretation for assessments. This data is used for modelling. The data is large and can be seen from the Opasnet Base. Technical parts on this page are hidden for readability. Building types should match Energy use of buildings#Baseline energy consumption.
| Show details | |||||||||||||||||||||||||||||||||||||||||||||||||||||||||||||||||||||||||||||||||||||||||||||||||||||||||||||||||||||||||||||||||||||||||||||||||||||||||||||||||||||||||||||||||||||||||||||||||||||||||||||||||||||||||||||||||||||||||||||||||||||||||||||||||||||||||||||||||||||||||||||||||||||||||||||||||||||||||||||||||||||||||||||||||||||||||||||||||||||||||||||||||||||||||||||||||||||||||||||
|---|---|---|---|---|---|---|---|---|---|---|---|---|---|---|---|---|---|---|---|---|---|---|---|---|---|---|---|---|---|---|---|---|---|---|---|---|---|---|---|---|---|---|---|---|---|---|---|---|---|---|---|---|---|---|---|---|---|---|---|---|---|---|---|---|---|---|---|---|---|---|---|---|---|---|---|---|---|---|---|---|---|---|---|---|---|---|---|---|---|---|---|---|---|---|---|---|---|---|---|---|---|---|---|---|---|---|---|---|---|---|---|---|---|---|---|---|---|---|---|---|---|---|---|---|---|---|---|---|---|---|---|---|---|---|---|---|---|---|---|---|---|---|---|---|---|---|---|---|---|---|---|---|---|---|---|---|---|---|---|---|---|---|---|---|---|---|---|---|---|---|---|---|---|---|---|---|---|---|---|---|---|---|---|---|---|---|---|---|---|---|---|---|---|---|---|---|---|---|---|---|---|---|---|---|---|---|---|---|---|---|---|---|---|---|---|---|---|---|---|---|---|---|---|---|---|---|---|---|---|---|---|---|---|---|---|---|---|---|---|---|---|---|---|---|---|---|---|---|---|---|---|---|---|---|---|---|---|---|---|---|---|---|---|---|---|---|---|---|---|---|---|---|---|---|---|---|---|---|---|---|---|---|---|---|---|---|---|---|---|---|---|---|---|---|---|---|---|---|---|---|---|---|---|---|---|---|---|---|---|---|---|---|---|---|---|---|---|---|---|---|---|---|---|---|---|---|---|---|---|---|---|---|---|---|---|---|---|---|---|---|---|---|---|---|---|---|---|---|---|---|---|---|---|---|---|---|---|---|---|---|---|---|---|---|---|---|---|---|---|---|---|---|---|---|---|---|---|---|---|---|---|---|---|---|---|---|---|---|---|---|---|---|---|---|---|---|---|
Data updated successfully!
----#: . Viimeiset 12 riviä (ilman numeroa) ovat tyyppejä jotka ovat datassa (tai ainakin vanhassa taulukossa) mutta puuttuvat Sonjan luokittelusta. --Jouni (talk) 12:57, 24 August 2015 (UTC) (type: truth; paradigms: science: comment) For residential buildings (classes A and B) the classification is kept more detailed than for other buildings. This is because residential buildings are the biggest energy consumers in Helsinki and different classes of residential buildings are examined separately.
The structures of the tables are based on CyPT Excel file N:\YMAL\Projects\ilmastotiekartta\Helsinki Data Input Template - Building Data.xlsx. |
Construction and demolition
It is assumed that construction occurs at a constant rate so that there is an increase of 42% in 2050 compared to 2013. Energy efficiency comes from Energy use of buildings.
Fraction of houses demolished per year.
Data updated successfully!
| Obs | Age | Rate |
|---|---|---|
| 1 | 0 | 0 |
| 2 | 50 | 1 |
| 3 | 1000 | 1 |
Heating type conversion
The fraction of heating types in the building stock reflects the situation at the moment of construction and not currently. The heating type conversion corrects this by changing a fraction of heating methods to a different one at different timepoints. Cumulative fraction, other timepoints will be interpolated.
Data updated successfully!
| Obs | Heating_from | Heating_to | Time | Result |
|---|---|---|---|---|
| 1 | Oil | Geothermal | 2005 | 0 |
| 2 | Oil | Geothermal | 2015 | 0.5 |
| 3 | Oil | Geothermal | 2025 | 1 |
Renovations
Estimates from Laura Perez and Stephan Trüeb, unibas.ch N:\YMAL\Projects\Urgenche\WP9 Basel\Energy_scenarios_Basel_update.docx
Data updated successfully!
| Obs | Age | Result | Description |
|---|---|---|---|
| 1 | 0 | 0 | Estimates from Laura Perez and Stephan Trüeb |
| 2 | 20 | 0 | Assumption Result applies to buildings older than the value in the Age column. |
| 3 | 25 | 1 | |
| 4 | 30 | 1 | |
| 5 | 50 | 1 | |
| 6 | 100 | 1 | |
| 7 | 1000 | 1 |
Data updated successfully!
| Obs | Renovation | Fraction | Description |
|---|---|---|---|
| 1 | None | 0 | |
| 2 | Windows | 65 | |
| 3 | Technical systems | 30 | |
| 4 | Sheath reform | 5 | |
| 5 | General | 0 |
Locations of city areas
- Locations of city areas (hidden for readability).
| Show details | |||||||||||||||||||||||||||||||||||||||||||||||||||||||||||||||||||||||||||||||||||||||||||||||||||||||||||||||||||||||||||||||||||||||||||||||||||||||||||||||||||||||||||||||||||||||||||||||||||||||||||||||||||||||||||||||||||||||||||||||||||||||||||||||||||||||||||||||||||||||||||||||||||||||||||||||||||||||||||||||||||||||||||||||||||||||||||||||||||||||||||||||||||||||||||||||||||||||||||||||||||||||||||||||||||||||||||||||||||||||||||||||||||||||||||||||||||||||||||||||||||||||||||||||||||||||||||||||||||
|---|---|---|---|---|---|---|---|---|---|---|---|---|---|---|---|---|---|---|---|---|---|---|---|---|---|---|---|---|---|---|---|---|---|---|---|---|---|---|---|---|---|---|---|---|---|---|---|---|---|---|---|---|---|---|---|---|---|---|---|---|---|---|---|---|---|---|---|---|---|---|---|---|---|---|---|---|---|---|---|---|---|---|---|---|---|---|---|---|---|---|---|---|---|---|---|---|---|---|---|---|---|---|---|---|---|---|---|---|---|---|---|---|---|---|---|---|---|---|---|---|---|---|---|---|---|---|---|---|---|---|---|---|---|---|---|---|---|---|---|---|---|---|---|---|---|---|---|---|---|---|---|---|---|---|---|---|---|---|---|---|---|---|---|---|---|---|---|---|---|---|---|---|---|---|---|---|---|---|---|---|---|---|---|---|---|---|---|---|---|---|---|---|---|---|---|---|---|---|---|---|---|---|---|---|---|---|---|---|---|---|---|---|---|---|---|---|---|---|---|---|---|---|---|---|---|---|---|---|---|---|---|---|---|---|---|---|---|---|---|---|---|---|---|---|---|---|---|---|---|---|---|---|---|---|---|---|---|---|---|---|---|---|---|---|---|---|---|---|---|---|---|---|---|---|---|---|---|---|---|---|---|---|---|---|---|---|---|---|---|---|---|---|---|---|---|---|---|---|---|---|---|---|---|---|---|---|---|---|---|---|---|---|---|---|---|---|---|---|---|---|---|---|---|---|---|---|---|---|---|---|---|---|---|---|---|---|---|---|---|---|---|---|---|---|---|---|---|---|---|---|---|---|---|---|---|---|---|---|---|---|---|---|---|---|---|---|---|---|---|---|---|---|---|---|---|---|---|---|---|---|---|---|---|---|---|---|---|---|---|---|---|---|---|---|---|---|---|---|---|---|---|---|---|---|---|---|---|---|---|---|---|---|---|---|---|---|---|---|---|---|---|---|---|---|---|---|---|---|---|---|---|---|---|---|---|---|---|---|---|---|---|---|---|---|---|---|---|---|---|---|---|---|---|---|---|---|---|---|---|---|---|---|---|---|---|---|---|---|---|---|---|---|---|---|---|---|---|---|---|---|---|---|---|---|---|---|---|---|---|---|---|---|---|---|---|---|---|---|---|---|---|---|---|---|---|---|---|---|---|---|---|---|---|---|---|
|
The positions listed here are used for exposure modelling. Area code matches with stock detail data on Building stock in Helsinki. The coordinates should be visually checked from http://www.karttapaikka.fi referencing picture X. Data updated successfully!
|
Data not used
This contains data that was not used in the model's calculations. This includes renovation rates, the rates of heat flowing out of buildings and total floor areas of multiple types of buildings in Helsinki. The floor area data is also found in the background data of this page, which was used in the model.
| Building | Baseline | 2020 | 2025 | 2050 | Year of baseline | Description |
| Residential | 27884795 | 32472388 | 34890241 | 44069914 | 2014 | Building stock of Helsinki area, 2014 |
| Public | 4537025 | 4764475 | 4945952 | 5855546 | 2014 | Building stock of Helsinki area, 2014 |
| Industrial | 3277271 | 3306063 | 3360467 | 3640854 | 2014 | Building stock of Helsinki area, 2014 |
| Other | 10861972 | 11406505 | 11840973 | 13806423 | 2014 | Building stock of Helsinki area, 2014 |
- Notes
- Estimates were based on
 Siemens City Performance toolin seuraava kokous 2.2 and some derived calculations on
  BUILDING STOCK CALCULATION 2015.
 - How to get the numbers for the baseline floor area for residential, public, industrial and other: Residential floor area was named as residential together, public by summing the floor area of health care, education and common buildings, industrial buildings were as such and other buildings comprise of business, traffic, office and storage buildings.
- Ref. Helsinki master plan for 2050: there are 860 000 citizens living in Helsinki (ref. www.yleiskaava.fi, visio2050); Residental buildings => fast growth
- Prediction of citizen number in Helsinki in 2020, 2030, 2040 and 2050 was used for calculations (ref. Helsingin 30% päästövähennysselvitys).
- Helsinki’s climate policy: 30% reduction in emissions: In 2010 the proportion of jobs in services and public sectors was 94%, and in industry 6%. In 2020 the proportion of jobs in services and public sectors is estimated to be 96%, and in industry 4%. Public and other buildings => between fast growth option and basic option, Industry=> Basic option
- Prediction of job number in Helsinki in 2020, 2030, 2040 and 2050 was used for calculations (ref. Helsingin 30% päästövähennysselvitys).
- Tables one and two The presentation of Tables 1 and 2
Technical notes:
- Sheet 4_Input Buildings (Area Demand). Priority 1. Auxiliaries PPT. Absolute increase/decrease rate will be based on the inhabitants projected in time.
- This is another list building types that was considered but rejected as too complex: Residential buildings, Government & public administration buildings, Commercial offices buildings, Data centers buildings, Education and K12 and universitiy buildings, Hospitals and healthcare buildings, Hotels and hospitality and leisure buildings, Exhibitions and fairs and halls buildings, Retail and stores and shops buildings, Warehouses & shopping mall buildings, Industrial buildings, Non residential buildings unspecified.
- There was a problem with missing data. There is more than 400000 m^2 floor area that is missing; this is estimated from total area that is available for these buildings. For other buildings, there is more than 400000 m^2 total area missing from buildings where floor area is given. See statistical analysis [1]. This was corrected by inputation so that is floor area was missing, 0.8*total_area was used instead [2].
| Construction year | Balcony glasses | Windows | Julkisivujen peruskorjaus | Vesikattojen peruskojaus | Lämmönvaihtimen uusiminen | Patteriverkoston säätö | Kylpyhuonekalusteiden vaihto | Patteriventtiilien vaihto | New balcony doors | LTO-laitteen asennus | Water consumption measurements |
|---|---|---|---|---|---|---|---|---|---|---|---|
| -20 | 0,0 % | 1,1 % | 1,1 % | 1,1 % | 1,1 % | 1,1 % | 1,1 % | 1,1 % | 1,1 % | 1,1 % | 1,1 % |
| 21-25 | 0,0 % | 10,3 % | 1,2 % | 11,1 % | 10,3 % | 10,3 % | 1,2 % | 10,3 % | 1,2 % | 10,3 % | 10,3 % |
| 26-30 | 0,0 % | 0,0 % | 0,0 % | 0,0 % | 0,0 % | 0,0 % | 0,0 % | 0,0 % | 0,0 % | 9,5 % | 0,0 % |
| 31-35 | 0,0 % | 0,0 % | 0,0 % | 0,0 % | 0,0 % | 0,0 % | 0,0 % | 0,0 % | 0,0 % | 0,0 % | 0,0 % |
| 36-40 | 0,0 % | 0,0 % | 0,0 % | 0,0 % | 4,2 % | 4,2 % | 0,0 % | 0,0 % | 0,0 % | 4,2 % | 0,0 % |
| 41-45 | 0,0 % | 16,7 % | 0,0 % | 16,7 % | 16,7 % | 16,7 % | 0,0 % | 16,7 % | 0,0 % | 16,7 % | 16,7 % |
| 46-50 | 0,0 % | 5,2 % | 0,0 % | 7,4 % | 7,4 % | 7,4 % | 0,0 % | 7,4 % | 0,0 % | 5,2 % | 5,2 % |
| 51-55 | 0,0 % | 11,3 % | 0,0 % | 8,8 % | 8,8 % | 8,8 % | 0,0 % | 8,8 % | 0,0 % | 8,8 % | 16,2 % |
| 56-60 | 0,0 % | 5,4 % | 0,0 % | 4,9 % | 6,2 % | 7,1 % | 0,0 % | 6,2 % | 4,5 % | 4,5 % | 5,4 % |
| 61-65 | 0,0 % | 1,5 % | 1,3 % | 0,8 % | 2,9 % | 2,4 % | 1,0 % | 2,4 % | 0,9 % | 0,9 % | 2,9 % |
| 66-70 | 0,6 % | 2,9 % | 1,2 % | 2,8 % | 1,4 % | 2,3 % | 1,1 % | 1,1 % | 0,1 % | 1,1 % | 1,1 % |
| 71-75 | 3,2 % | 3,1 % | 3,4 % | 2,9 % | 3,1 % | 2,6 % | 0,2 % | 1,1 % | 0,2 % | 0,2 % | 0,2 % |
| 76-80 | 0,1 % | 2,7 % | 0,1 % | 0,7 % | 2,0 % | 1,7 % | 1,1 % | 1,2 % | 0,2 % | 0,4 % | 0,2 % |
| 81-85 | 1,0 % | 2,8 % | 0,7 % | 2,3 % | 3,3 % | 4,8 % | 3,5 % | 0,0 % | 0,0 % | 0,0 % | 0,8 % |
| 86-90 | 0,0 % | 1,3 % | 0,0 % | 2,1 % | 6,1 % | 1,6 % | 0,7 % | 1,8 % | 0,3 % | 0,3 % | 1,0 % |
| 91-95 | 0,6 % | 0,3 % | 0,0 % | 3,9 % | 8,6 % | 1,9 % | 5,1 % | 0,8 % | 0,2 % | 0,0 % | 1,3 % |
| 96-00 | 0,1 % | 0,0 % | 0,0 % | 0,6 % | 1,2 % | 1,0 % | 1,5 % | 1,0 % | 0,0 % | 0,0 % | 4,2 % |
| 01-05 | 2,9 % | 0,0 % | 0,0 % | 0,0 % | 1,2 % | 1,0 % | 0,0 % | 1,0 % | 0,0 % | 0,0 % | 0,7 % |
| 06-10 | 1,7 % | 0,0 % | 0,0 % | 0,0 % | 0,5 % | 0,5 % | 0,0 % | 0,5 % | 0,0 % | 0,0 % | 0,0 % |
←--#: . In the document there are similar tables for total renovations from 2010 onwards to years 2016, 2020 and 2050. --Heta (talk) 09:28, 16 June 2015 (UTC) (type: truth; paradigms: science: defence)
| Action | The feature in question | Difference to before | Unit | Notes |
|---|---|---|---|---|
| Glass for balconies | U-value for windows | -0,3 | W/m2,K | Säästö 1-4% rakennustasolla |
| Changing the windows | U-value for windows | -1 | W/m2,K | Vanhoista osa kaksilasisia ja osa kolmilasisia. Uudes 1,0 W/m2,K tai alle |
| Julkisivun peruskorjaus | U-value of walls | -0,2 | W/m2,K | U-arvo puolitetaan eli n. 100 mm lisäeristys |
| Vesikattojen peruskorjaus | Yläpohjan U-arvo | -0,15 | W/m2,K | Oletetaan 50% lisäeristys U-arvo puoleen eli n. 100 mm lisäerstys |
| Balcony door change | U-value of doors | -0,5 | W/m2,K | Tiivistyminen tuo lisäsäästöä |
| Construction decade | Thermal transmittance factors for building components (W/m2K) | Ventilation and leakage air rates (1/h) | |||||||
| Floor | Roof | Walls | Windows | Outdoors | Supply air through the heat recovery unit | Supply air bypassing the heat recovery unit | Leakage air | ||
| Before 1980 | Single family house | 0.52 | 0.32 | 0.54 | 2.14 | 1.18 | 0.30 | 0.05 | 0.20 |
| Row house | 0.52 | 0.36 | 0.56 | 2.15 | 1.00 | 0.3 | 0.05 | 0.20 | |
| Apartment building | 0.59 | 0.37 | 0.61 | 2.18 | 1.40 | 0.37 | 0.00 | 0.10 | |
| 1980's | Single family house | 0.30 | 0.21 | 0.28 | 1.70 | 1.00 | 0.30 | 0.05 | 0.15 |
| Row house | 0.32 | 0.22 | 0.30 | 1.70 | 1.00 | 0.30 | 0.05 | 0.15 | |
| Apartment building | 0.34 | 0.23 | 0.29 | 1.80 | 1.40 | 0.35 | 0.00 | 0.10 | |
| 1990's | Single family house | 0.25 | 0.20 | 0.25 | 1.70 | 1.00 | 0.30 | 0.05 | 0.15 |
| Row house | 0.32 | 0.22 | 0.28 | 1.70 | 1.00 | 0.30 | 0.05 | 0.15 | |
| Apartment building | 0.332 | 0.22 | 0.28 | 1.75 | 1.40 | 0.38 | 0.00 | 0.10 | |
| 2000's | Single family house | 0.24 | 0.17 | 0.24 | 1.40 | 1.00 | 0.30 | 0.05 | 0.13 |
| Row house | 0.28 | 0.18 | 0.26 | 1.50 | 1.00 | 0.45 | 0.05 | 0.15 | |
| Apartment building | 0.28 | 0.18 | 0.26 | 1.50 | 1.40 | 0.55 | 0.00 | 0.10 | |
| 2010's | Single family house | 0.16 | 0.09 | 0.17 | 1.00 | 1.00 | 0.30 | 0.05 | 0.10 |
| Row house | 0.16 | 0.09 | 0.17 | 1.00 | 1.00 | 0.50 | 0.05 | 0.15 | |
| Apartment building | 0.16 | 0.09 | 0.17 | 1.00 | 1.00 | 0.60 | 0.00 | 0.10 | |
See also
- Building stock in Helsinki metropolitan area
- Descriptions about the summary calculations on sheet Parameter Balance (not needed any more).
- Rakennustietoruudukko pääkaupunkiseudulta [3]
- Unit heat consumption of buildings in Finland
- Sitra, page 25
- Tee parannus pages 8-9, also 40-45
- VTT tiedotteet page 20-21, also 30, 80
- Heating consumption of buildings
- Lämmitystapavalintojen kehitys
References
- ↑ 1.0 1.1 HAESS Final report, Tampere University of Technology, 2010
- ↑ MK Mattinen, J Heljo, J Vihola, A Kurvinen, S Lehtoranta, A Nissinen: Modeling and visualisation of residential sector energy consumption and greenhouse gas emissions