Evolutionary origin of human traits: Difference between revisions
(link to How scientists perceive the evolutionary origin of human traits: results of a survey study) |
|||
| (32 intermediate revisions by 2 users not shown) | |||
| Line 4: | Line 4: | ||
[[Category:Contains R code]] | [[Category:Contains R code]] | ||
{{variable|moderator=Hanna}} | {{variable|moderator=Hanna}} | ||
'''Evolutionary origin of human traits''' is a variable page about the topic. For a survey study looking at researchers' opinions about this topic, see [[How scientists perceive the evolutionary origin of human traits: results of a survey study]] | |||
== Question == | == Question == | ||
| Line 12: | Line 13: | ||
== Rationale == | == Rationale == | ||
=== Hypotheses === | |||
There are conflicting hypotheses to explain why the traits that so clearly distinguish humans from other primates originally evolved. One idea is that the ancestors of humans came to live in a different kind of environment than the ancestors of chimpanzees and gorillas, and hence experienced different selection pressures and obtained a suite of unique traits as adaptations to the new environment. What that new environment was and which selection pressures were most important has been debated, however, and a number of hypotheses based on ideas other than environmental adaptation have also been proposed. To date, general discussion on the topic seems mostly to have focused on finding merit or flaws in one hypothesis at a time. The purpose of this page is to provide a structured forum for the general evaluation and comparison of the different hypotheses on human origins. | There are conflicting hypotheses to explain why the traits that so clearly distinguish humans from other primates originally evolved. One idea is that the ancestors of humans came to live in a different kind of environment than the ancestors of chimpanzees and gorillas, and hence experienced different selection pressures and obtained a suite of unique traits as adaptations to the new environment. What that new environment was and which selection pressures were most important has been debated, however, and a number of hypotheses based on ideas other than environmental adaptation have also been proposed. To date, general discussion on the topic seems mostly to have focused on finding merit or flaws in one hypothesis at a time. The purpose of this page is to provide a structured forum for the general evaluation and comparison of the different hypotheses on human origins. | ||
| Line 130: | Line 133: | ||
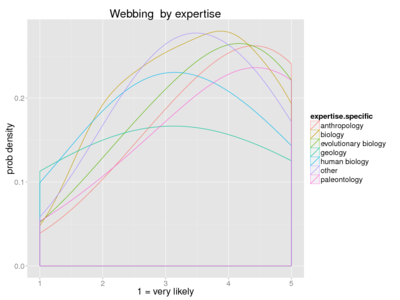
| Webbing || Humans have partial webbing between their fingers and toes. Webbed feet are common among semi-aquatic animals (such as otters and ducks), but are not found in non-human primates. | | Webbing || Humans have partial webbing between their fingers and toes. Webbed feet are common among semi-aquatic animals (such as otters and ducks), but are not found in non-human primates. | ||
|--- | |--- | ||
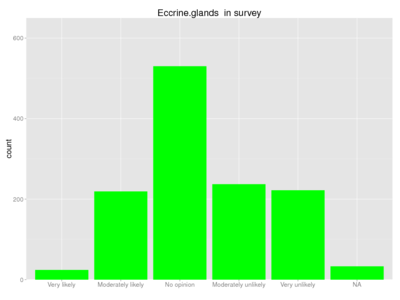
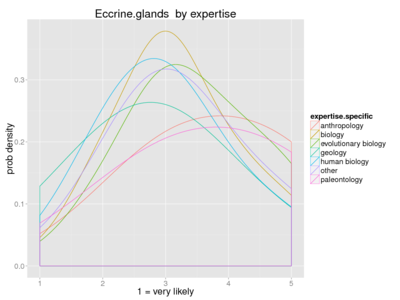
| Eccrine glands || Cooling sweat is excreted from eccrine glands in humans but from apocrine glands in other primates. | | Eccrine glands || Cooling sweat is excreted from eccrine glands in humans but from apocrine glands in other primates. Apocrine glands could have lost their thermoregulatory function in human ancestors during a period when dip-cooling replaced sweat-cooling. | ||
|--- | |--- | ||
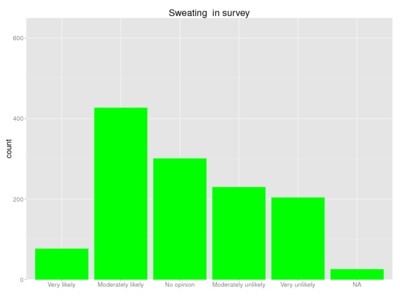
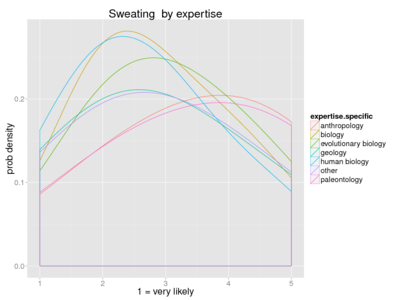
| Sweating || Humans sweat more profusely than any other primate. Since this can lead to fatal loss of water and electrolytes in a few hours, the trait probably evolved in conditions of abundant water and salt supply. | | Sweating || Humans sweat more profusely than any other primate. Since this can lead to fatal loss of water and electrolytes in a few hours, the trait probably evolved in conditions of abundant water and salt supply. | ||
| Line 146: | Line 147: | ||
For single answer analyses, multinomial regression models should be applied. | For single answer analyses, multinomial regression models should be applied. | ||
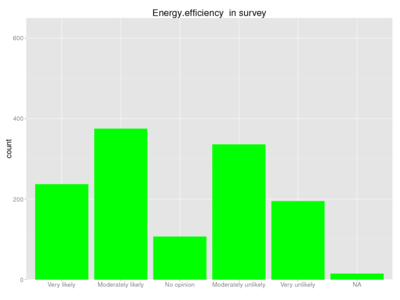
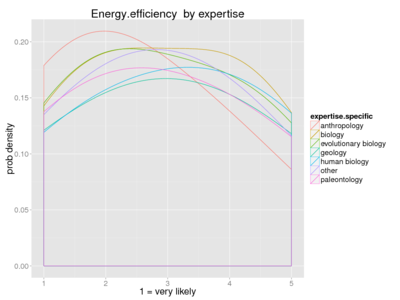
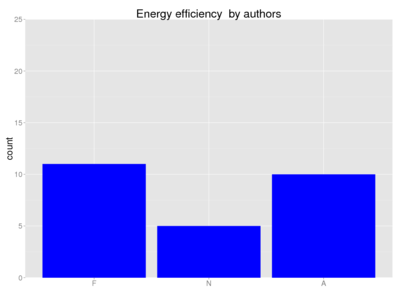
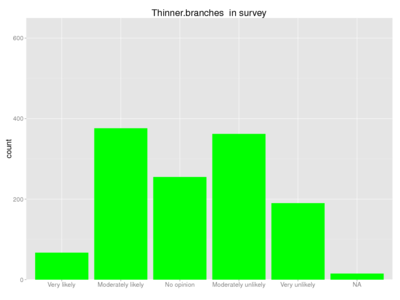
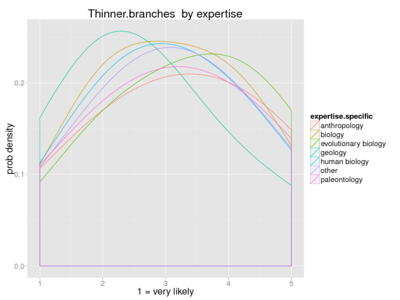
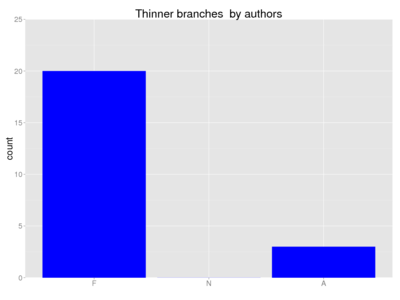
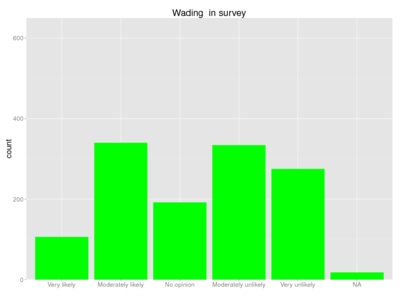
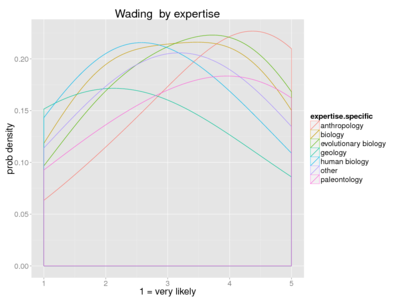
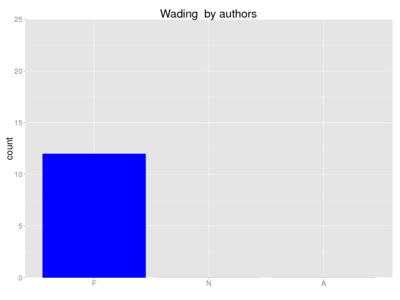
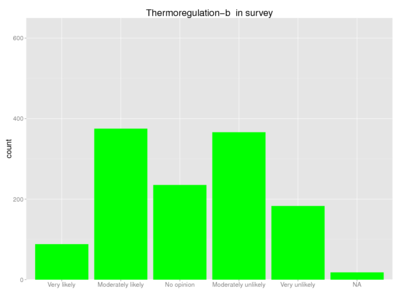
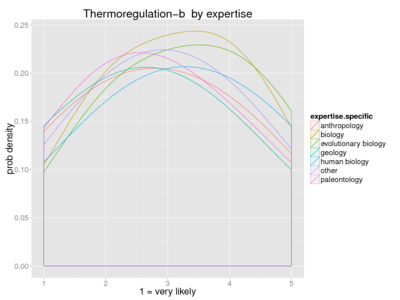
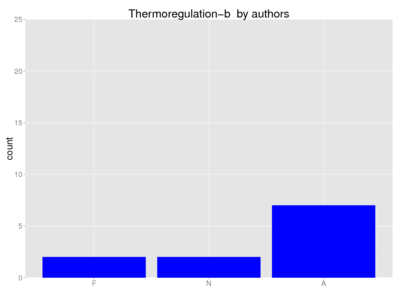
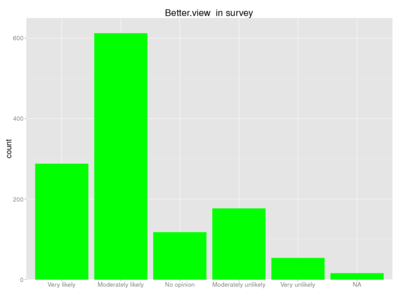
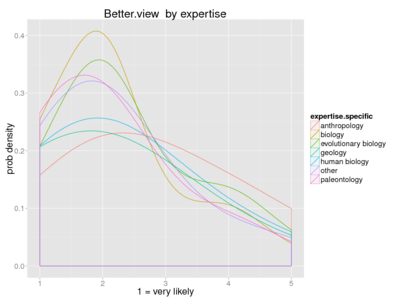
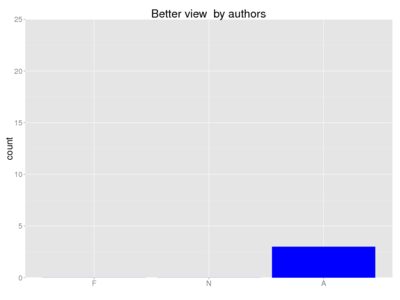
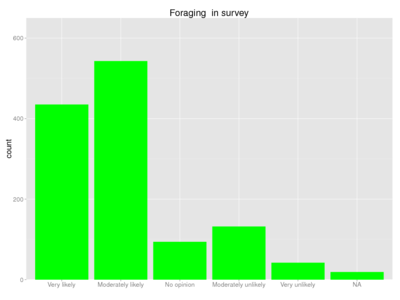
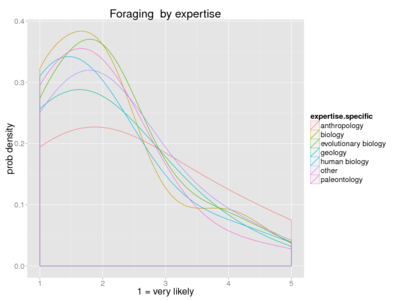
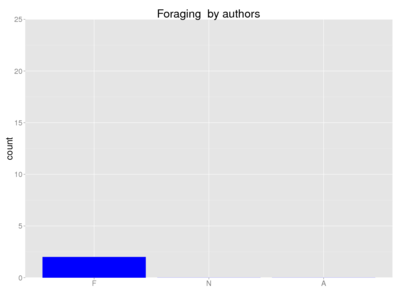
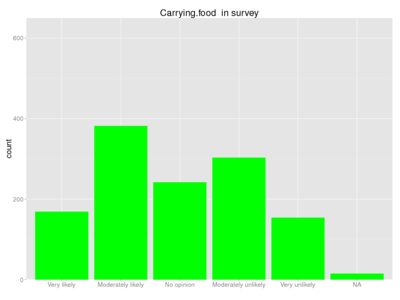
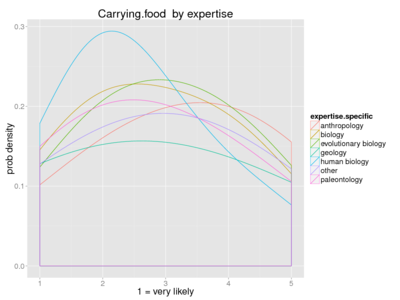
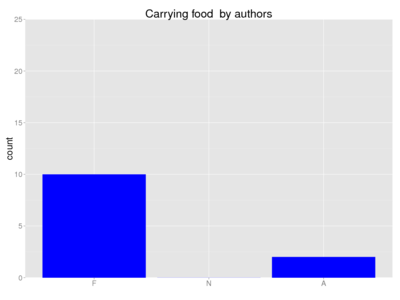
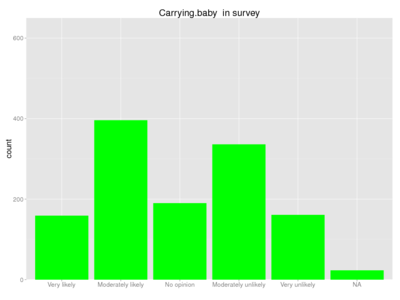
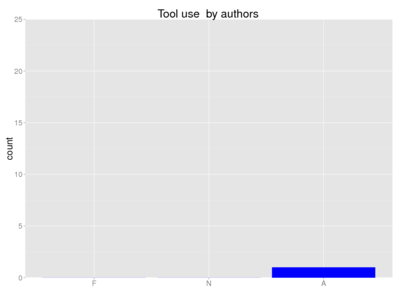
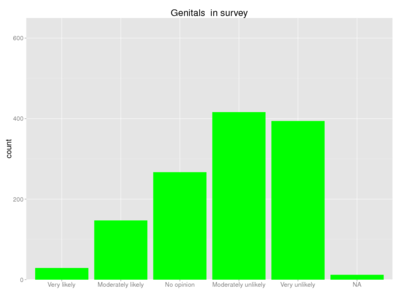
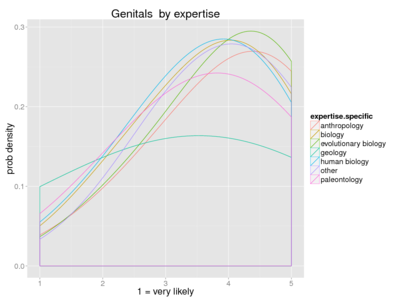
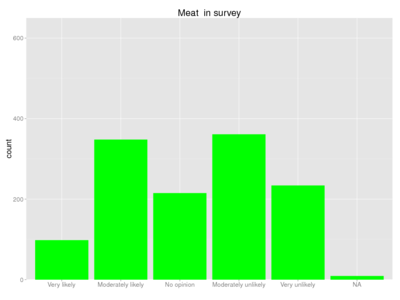
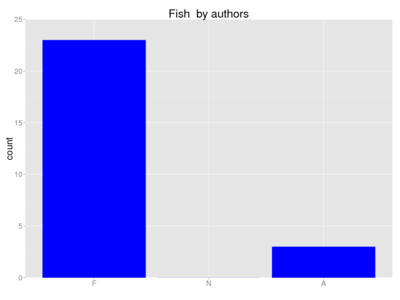
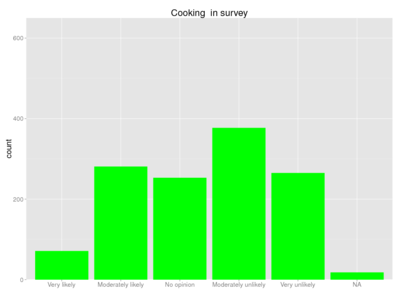
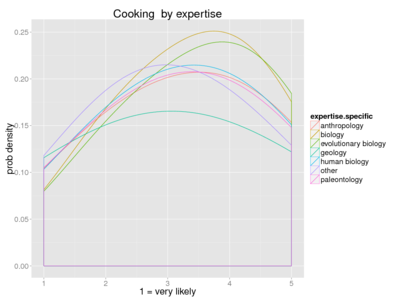
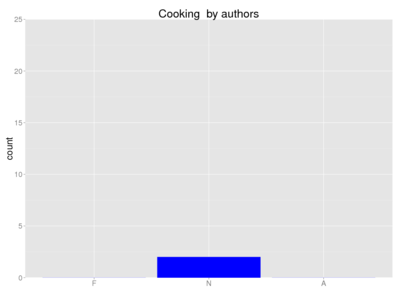
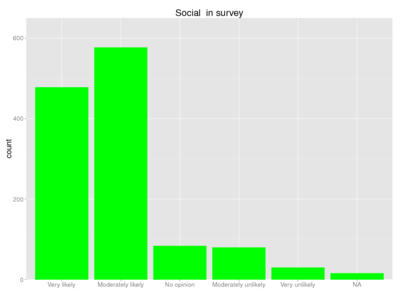
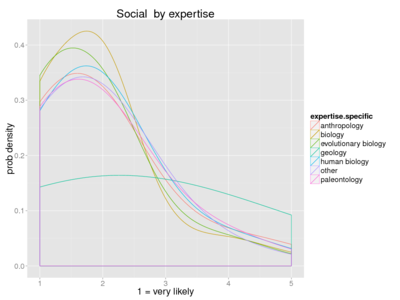
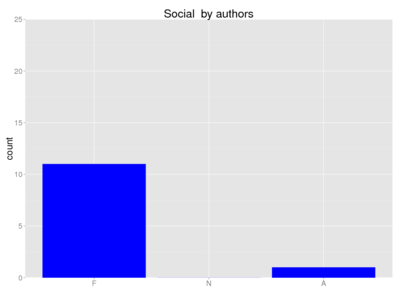
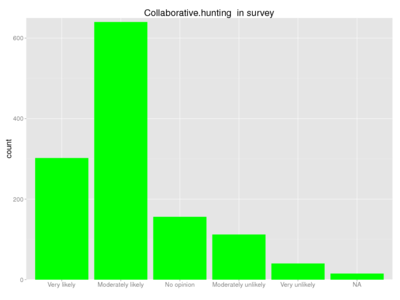
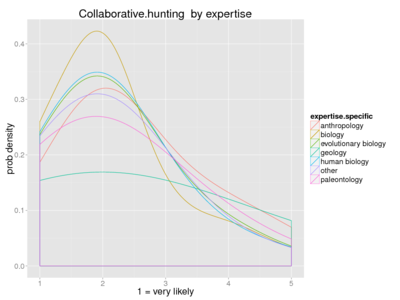
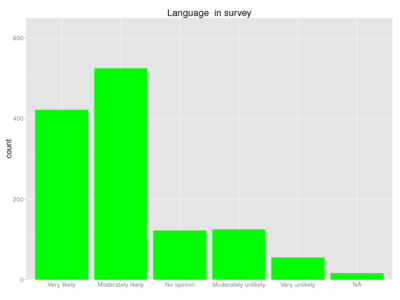
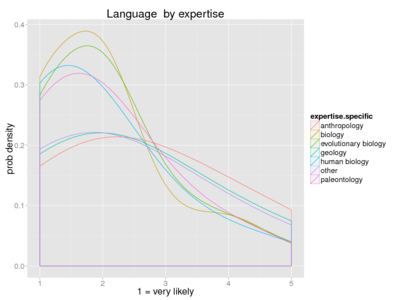
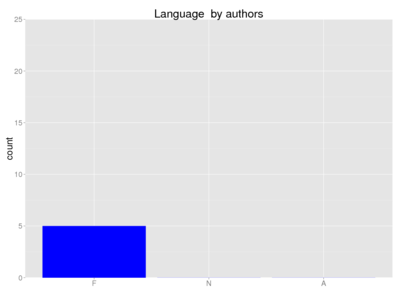
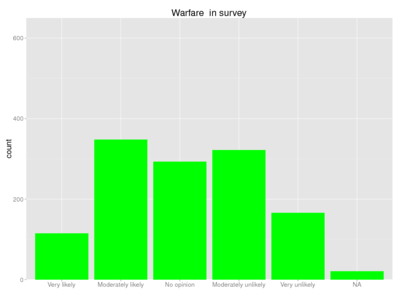
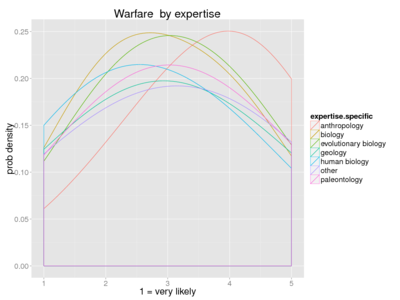
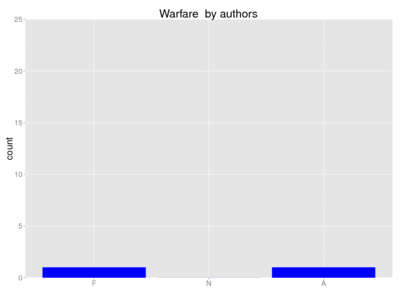
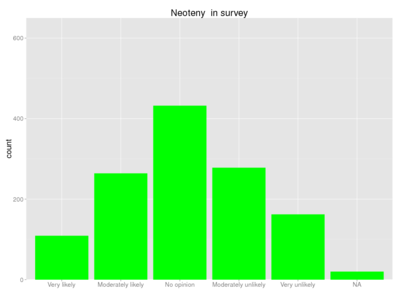
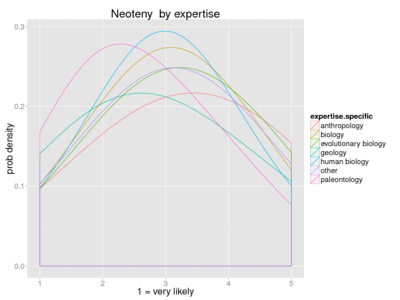
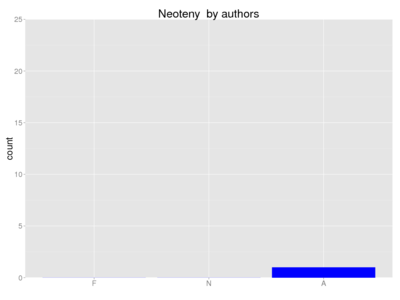
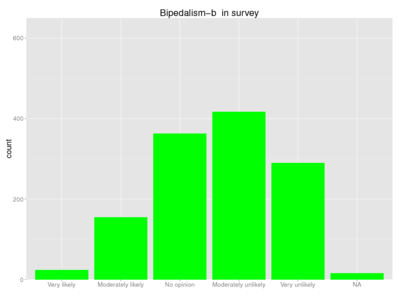
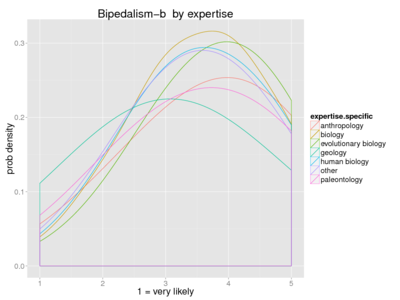
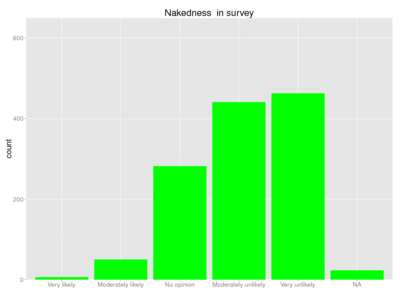
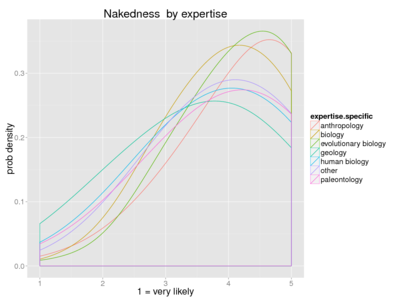
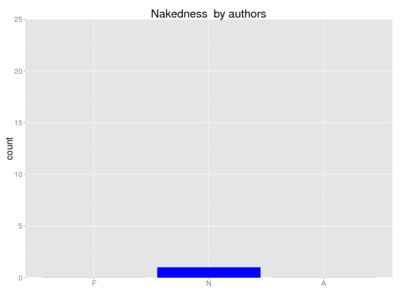
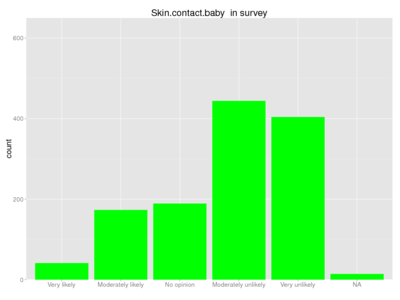
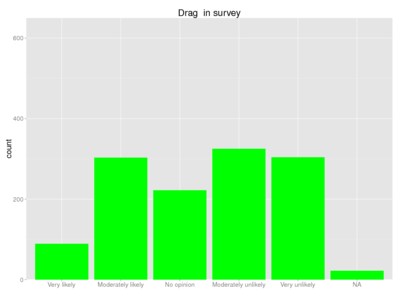
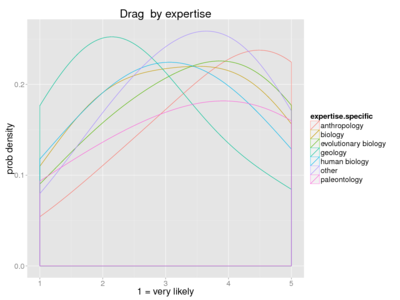
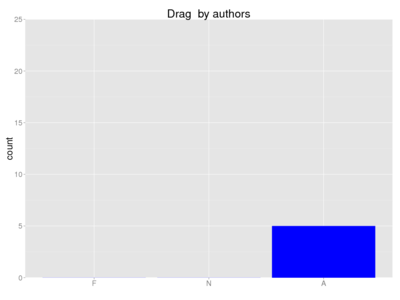
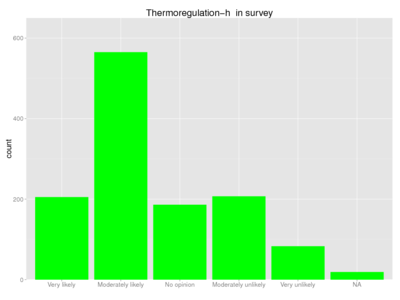
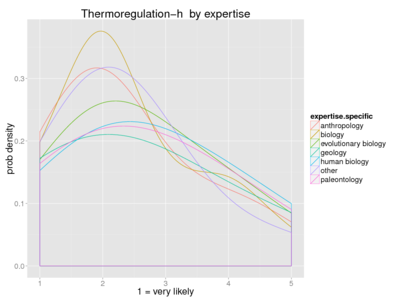
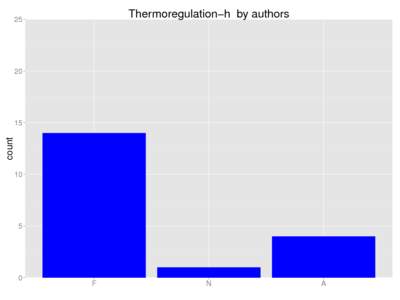
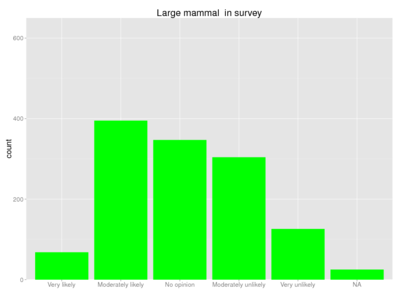
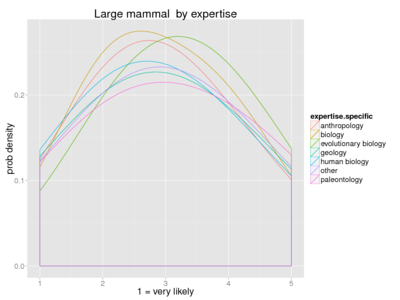
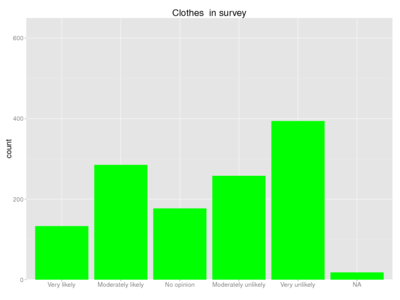
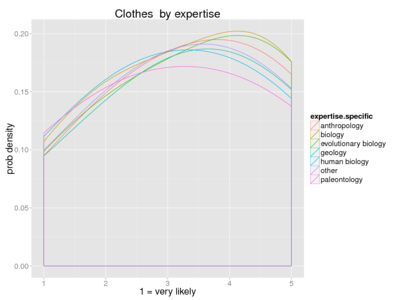
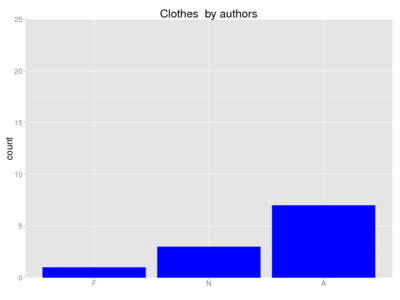
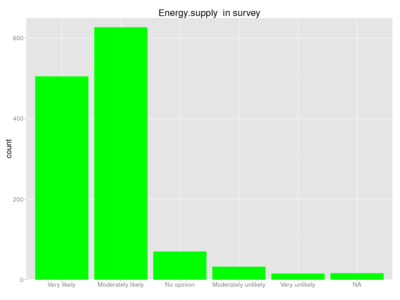
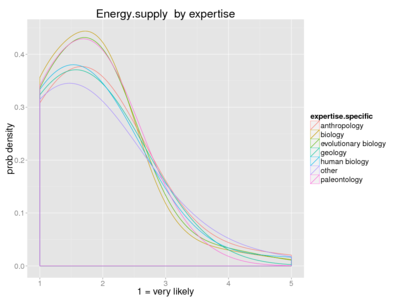
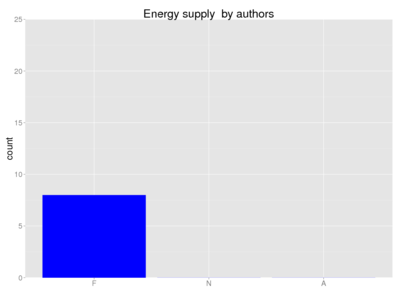
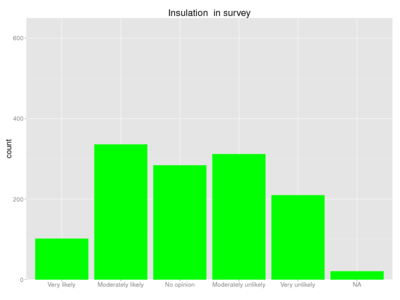
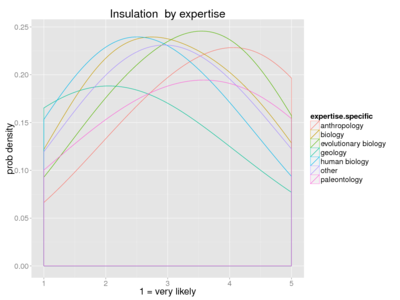
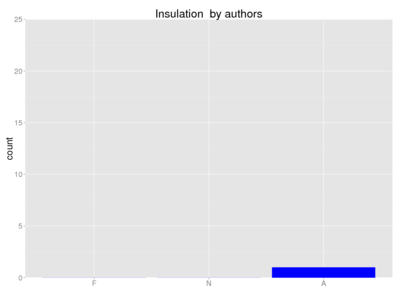
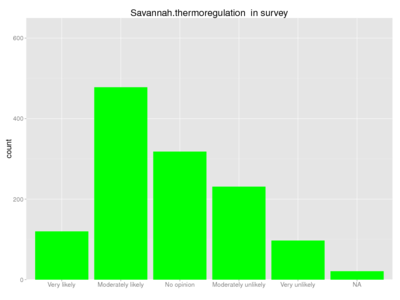
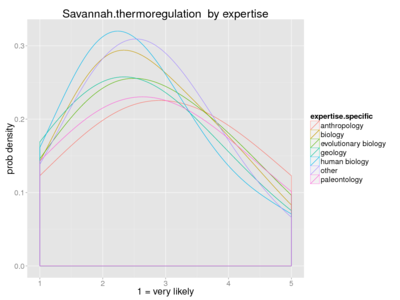
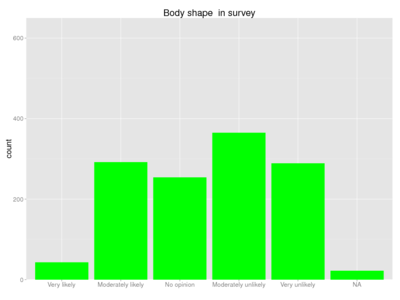
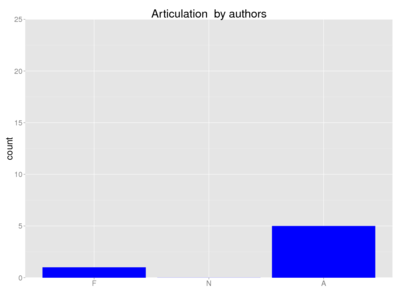
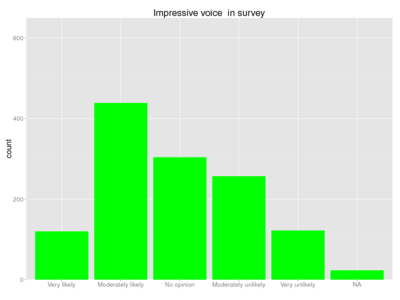
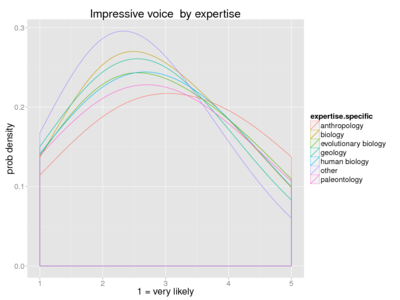
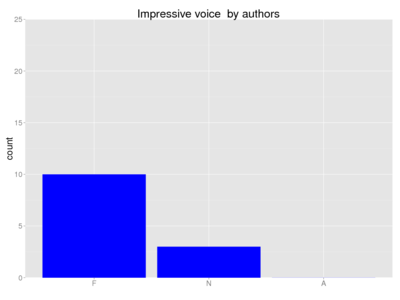
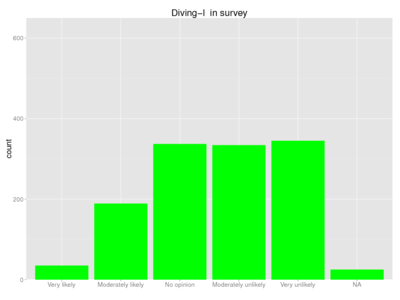
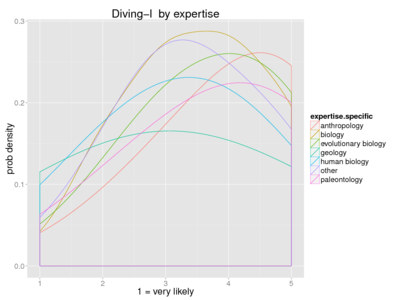
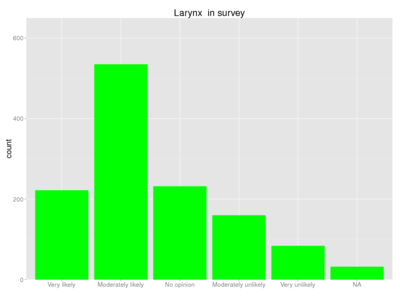
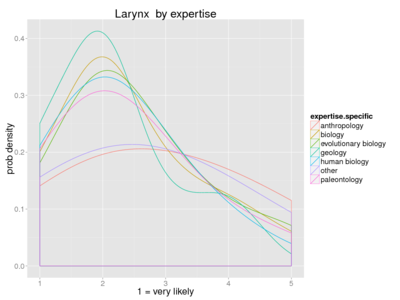
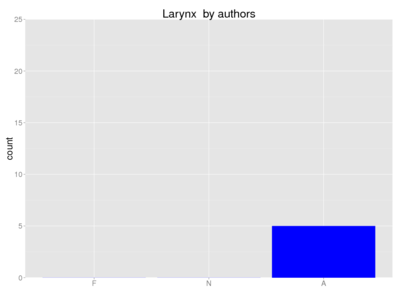
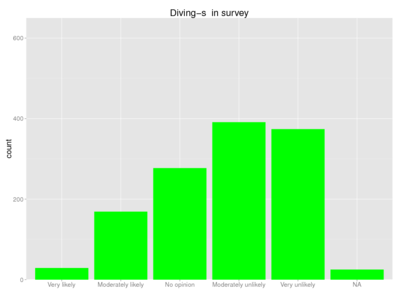
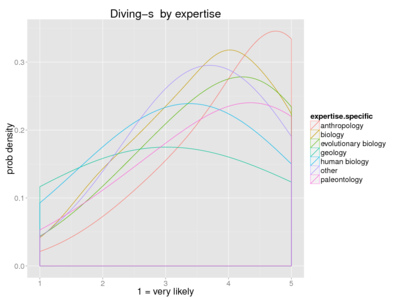
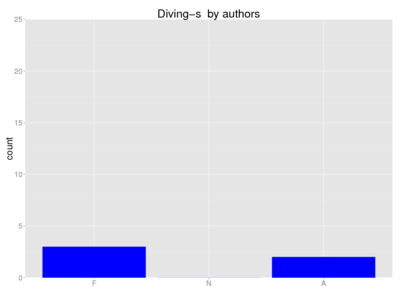
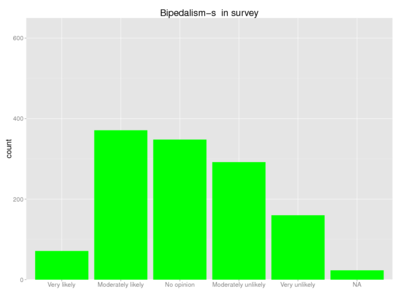
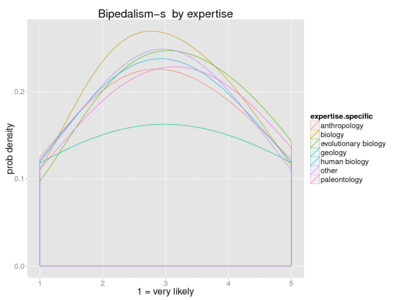
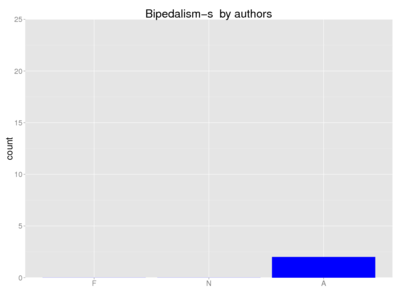
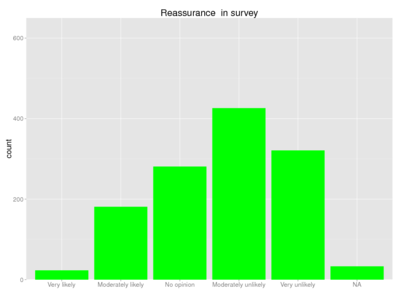
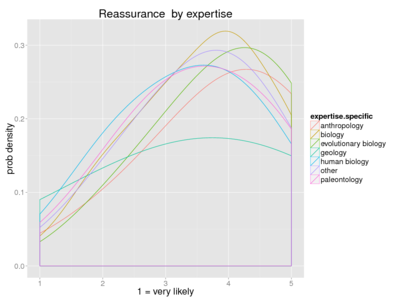
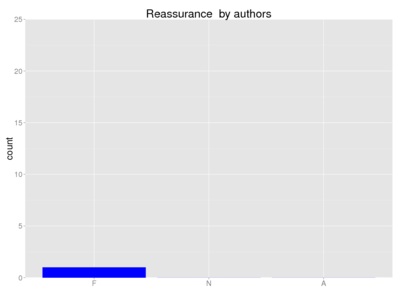
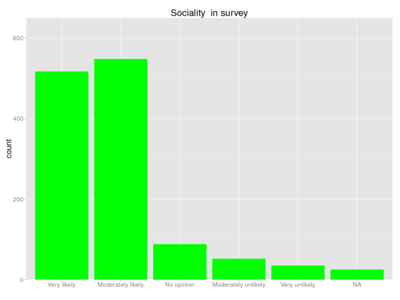
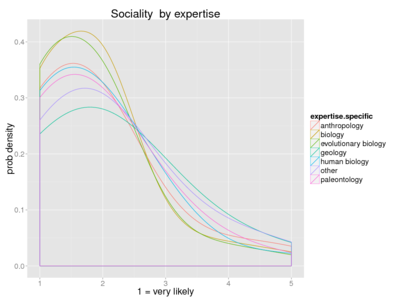
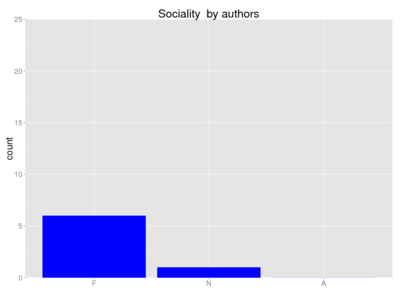
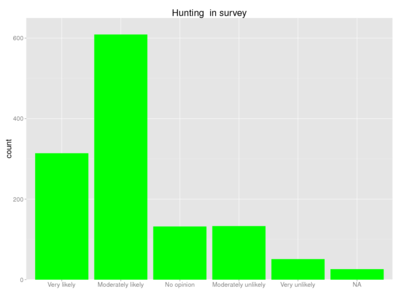
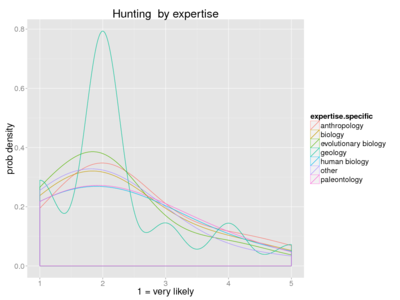
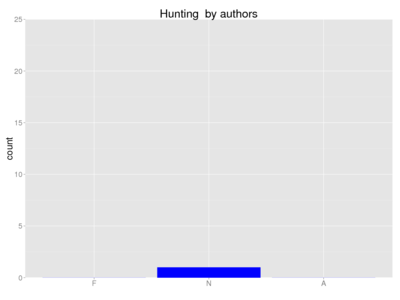
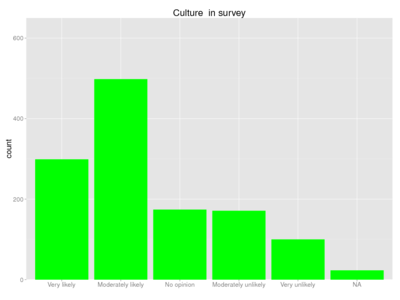
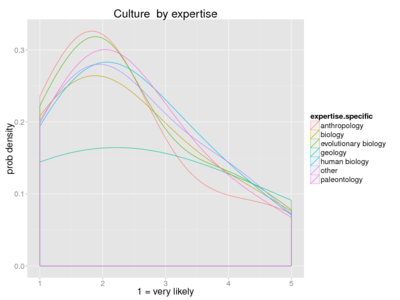
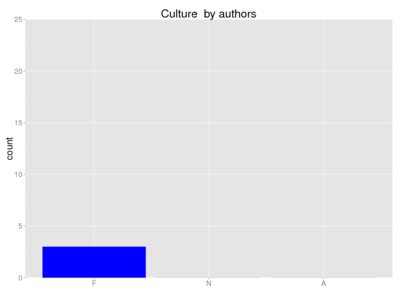
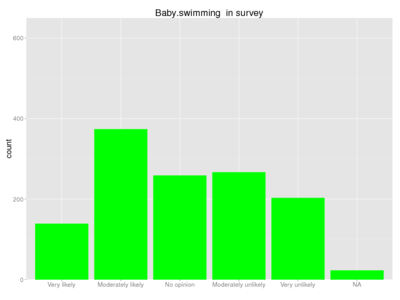
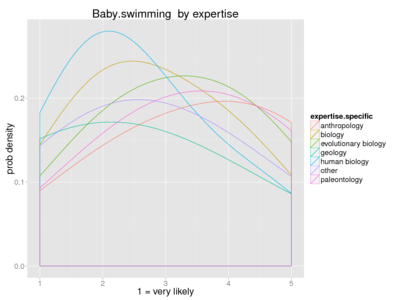
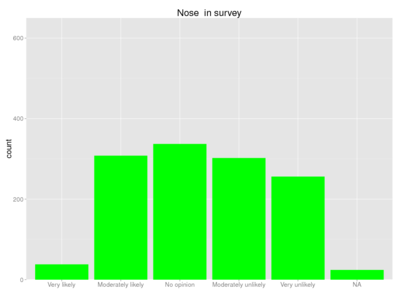
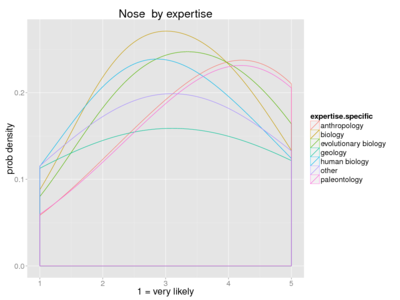
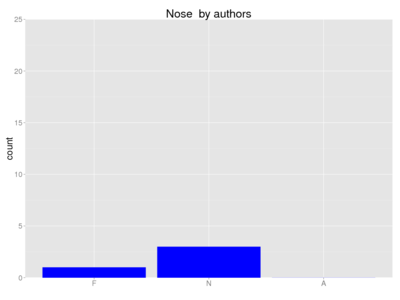
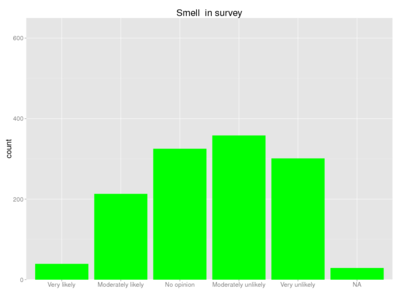
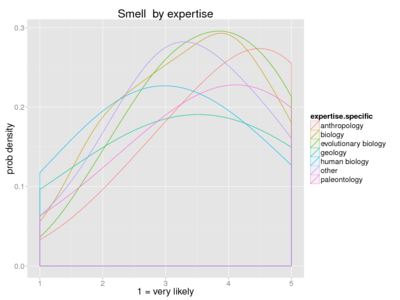
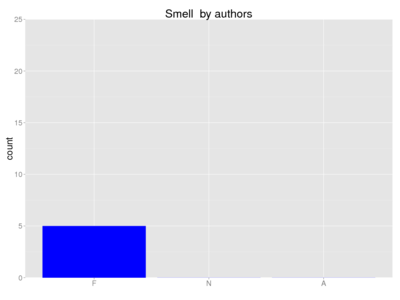
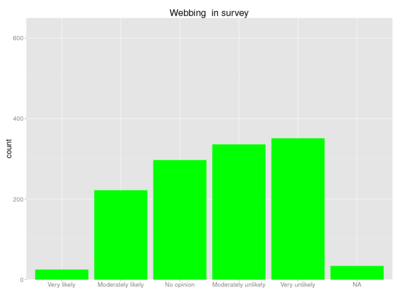
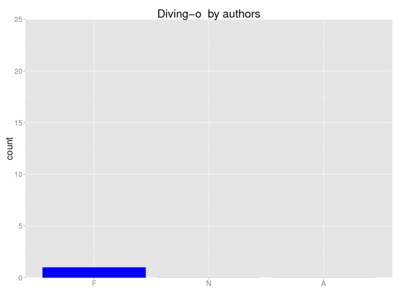
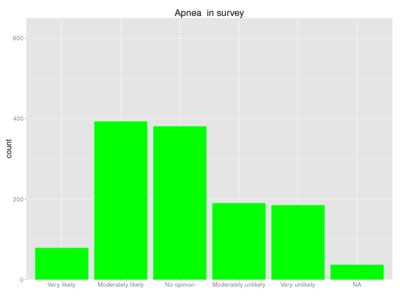
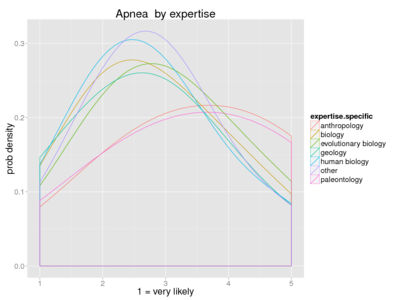
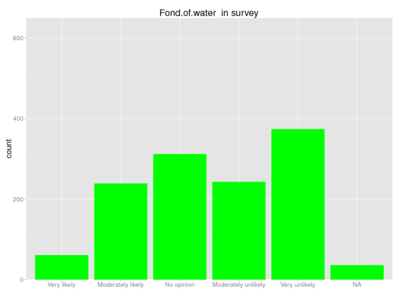
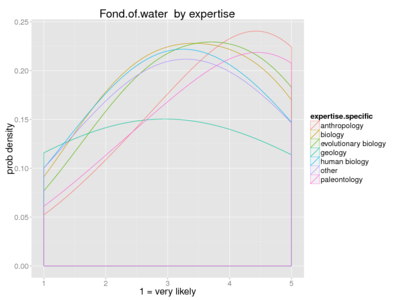
In the following sections, we will present results about support to different hypotheses explaining the traits studied. We have two sources of information and three graphs for each hypothesis: Survey to authors of relevant journals, with ca. 1200 responses; and authors of articles about human evolution and the traits of interest (272 individual authors). The survey graphs on the left show the repondents' views on how likely each hypothesis is. The middle graphs show the same information separated by the expertise of the respondent (and for visibility, we assumed the X axis to be continous so that we could draw probability densities). The graphs on the right show the support from article authors in the literature review. Each hypothesis has one row of graphs, and they are ordered by the trait the hypotheses explain. | |||
==== Bipedalism ==== | |||
{| class="wikitable collapsible collapsed" | |||
! Show details | |||
|---- | |||
| [[File:human_energy_efficiency_survey.png|400px]] || [[File:human_energy_efficiency_expertise.png|400px]] || [[File:human_energy_efficiency_author.png|400px]] | |||
|--- | |||
| [[File:human_thinner_branches_survey.png|400px]] || [[File:human_thinner_branches_expertise.png|400px]] || [[File:human_thinner_branches_author.png|400px]] | |||
|--- | |||
| [[File:human_wading_survey.png|400px]] || [[File:human_wading_expertise.png|400px]] || [[File:human_wading_author.png|400px]] | |||
|--- | |||
| [[File:human_thermoregulation-b_survey.png|400px]] || [[File:human_thermoregulation-b_expertise.png|400px]] || [[File:human_thermoregulation-b_author.png|400px]] | |||
|--- | |||
| [[File:human_better_view_survey.png|400px]] || [[File:human_better_view_expertise.png|400px]] || [[File:human_better_view_author.png|400px]] | |||
|--- | |||
| [[File:human_foraging_survey.png|400px]] || [[File:human_foraging_expertise.png|400px]] || [[File:human_foraging_author.png|400px]] | |||
|--- | |||
| [[File:human_carrying_food_survey.png|400px]] || [[File:human_carrying_food_expertise.png|400px]] || [[File:human_carrying_food_author.png|400px]] | |||
|--- | |||
| [[File:human_carrying_baby_survey.png|400px]] || [[File:human_carrying_baby_expertise.png|400px]] || [[File:human_carrying_baby_author.png|400px]] | |||
|--- | |||
| [[File:human_tool_use_survey.png|400px]] || [[File:human_tool_use_expertise.png|400px]] || [[File:human_tool_use_author.png|400px]] | |||
|--- | |||
| [[File:human_genitals_survey.png|400px]] || [[File:human_genitals_expertise.png|400px]] || | |||
|--- | |||
|} | |||
==== Brain ==== | |||
{| class="wikitable collapsible collapsed" | |||
! Show details | |||
|--- | |||
| [[File:human_meat_survey.png|400px]] || [[File:human_meat_expertise.png|400px]] || [[File:human_meat_author.png|400px]] | |||
|--- | |||
| [[File:human_fish_survey.png|400px]] || [[File:human_fish_expertise.png|400px]] || [[File:human_fish_author.png|400px]] | |||
|--- | |||
| [[File:human_cooking_survey.png|400px]] || [[File:human_cooking_expertise.png|400px]] || [[File:human_cooking_author.png|400px]] | |||
|--- | |||
| [[File:human_social_survey.png|400px]] || [[File:human_social_expertise.png|400px]] || [[File:human_social_author.png|400px]] | |||
|--- | |||
| [[File:human_collaborative_hunting_survey.png|400px]] || [[File:human_collaborative_hunting_expertise.png|400px]] || [[File:human_collaborative_hunting_author.png|400px]] | |||
|--- | |||
| [[File:human_language_survey.png|400px]] || [[File:human_language_expertise.png|400px]] || [[File:human_language_author.png|400px]] | |||
|--- | |||
| [[File:human_warfare_survey.png|400px]] || [[File:human_warfare_expertise.png|400px]] || [[File:human_warfare_author.png|400px]] | |||
|--- | |||
| [[File:human_neoteny_survey.png|400px]] || [[File:human_neoteny_expertise.png|400px]] || [[File:human_neoteny_author.png|400px]] | |||
|--- | |||
| [[File:human_bipedalism-b_survey.png|400px]] || [[File:human_bipedalism-b_expertise.png|400px]] || | |||
|--- | |||
| [[File:human_nakedness_survey.png|400px]] || [[File:human_nakedness_expertise.png|400px]] || [[File:human_nakedness_author.png|400px]] | |||
|--- | |||
|} | |||
==== Nakedness ==== | |||
{| class="wikitable collapsible collapsed" | |||
! Show details | |||
|--- | |||
| [[File:human_skin_contact_baby_survey.png|400px]] || [[File:human_skin_contact_baby_expertise.png|400px]] || [[File:human_skin_contact_baby_author.png|400px]] | |||
|--- | |||
| [[File:human_skin_contact_sex_survey.png|400px]] || [[File:human_skin_contact_sex_expertise.png|400px]] || [[File:human_skin_contact_sex_author.png|400px]] | |||
|--- | |||
| [[File:human_cleanliness_survey.png|400px]] || [[File:human_cleanliness_expertise.png|400px]] || | |||
|--- | |||
| [[File:human_ectoparasites_survey.png|400px]] || [[File:human_ectoparasites_expertise.png|400px]] || [[File:human_ectoparasites_author.png|400px]] | |||
|--- | |||
| [[File:human_drag_survey.png|400px]] || [[File:human_drag_expertise.png|400px]] || [[File:human_drag_author.png|400px]] | |||
|--- | |||
| [[File:human_thermoregulation-h_survey.png|400px]] || [[File:human_thermoregulation-h_expertise.png|400px]] || [[File:human_thermoregulation-h_author.png|400px]] | |||
|--- | |||
| [[File:human_large_mammal_survey.png|400px]] || [[File:human_large_mammal_expertise.png|400px]] || | |||
|--- | |||
| [[File:human_clothes_survey.png|400px]] || [[File:human_clothes_expertise.png|400px]] || [[File:human_clothes_author.png|400px]] | |||
|--- | |||
|} | |||
==== Subcutaneous fat ==== | |||
{| class="wikitable collapsible collapsed" | |||
! Show details | |||
|--- | |||
| [[File:human_energy_supply_survey.png|400px]] || [[File:human_energy_supply_expertise.png|400px]] || [[File:human_energy_supply_author.png|400px]] | |||
|--- | |||
| [[File:human_insulation_survey.png|400px]] || [[File:human_insulation_expertise.png|400px]] || [[File:human_insulation_author.png|400px]] | |||
|--- | |||
| [[File:human_savannah_thermoregulation_survey.png|400px]] || [[File:human_savannah_thermoregulation_expertise.png|400px]] || [[File:human_savannnah_thermoregulation_author.png|400px]] | |||
|--- | |||
| [[File:human_body_shape_survey.png|400px]] || [[File:human_body_shape_expertise.png|400px]] || [[File:human_body_shape_author.png|400px]] | |||
|--- | |||
|} | |||
==== Larynx ==== | |||
{| class="wikitable collapsible collapsed" | |||
! Show details | |||
|--- | |||
| [[File:human_articulation_survey.png|400px]] || [[File:human_articulation_expertise.png|400px]] || [[File:human_articulation_author.png|400px]] | |||
|--- | |||
| [[File:human_impressive_voice_survey.png|400px]] || [[File:human_impressive_voice_expertise.png|400px]] || [[File:human_impressive_voice_author.png|400px]] | |||
|--- | |||
| [[File:human_diving-l_survey.png|400px]] || [[File:human_diving-l_expertise.png|400px]] || | |||
|--- | |||
|} | |||
==== Speech ==== | |||
{| class="wikitable collapsible collapsed" | |||
! Show details | |||
|--- | |||
| [[File:human_larynx_survey.png|400px]] || [[File:human_larynx_expertise.png|400px]] || [[File:human_larynx_author.png|400px]] | |||
|--- | |||
| [[File:human_diving-s_survey.png|400px]] || [[File:human_diving-s_expertise.png|400px]] || [[File:human_diving-s_author.png|400px]] | |||
|--- | |||
| [[File:human_bipedalism-s_survey.png|400px]] || [[File:human_bipedalism-s_expertise.png|400px]] || [[File:human_bipedalism-s_author.png|400px]] | |||
|--- | |||
| [[File:human_reassurance_survey.png|400px]] || [[File:human_reassurance_expertise.png|400px]] || [[File:human_reassurance_author.png|400px]] | |||
|--- | |||
| [[File:human_sociality_survey.png|400px]] || [[File:human_sociality_expertise.png|400px]] || [[File:human_sociality_author.png|400px]] | |||
|--- | |||
| [[File:human_hunting_survey.png|400px]] || [[File:human_hunting_expertise.png|400px]] || [[File:human_hunting_author.png|400px]] | |||
|--- | |||
| [[File:human_culture_survey.png|400px]] || [[File:human_culture_expertise.png|400px]] || [[File:human_culture_author.png|400px]] | |||
|--- | |||
|} | |||
==== Other traits ==== | |||
{| class="wikitable collapsible collapsed" | |||
|+'''Other traits that could be explained by a waterside hypothesis | |||
! Show details | |||
|--- | |||
| [[File:human_baby_swimming_survey.png|400px]] || [[File:human_baby_swimming_expertise.png|400px]] || | |||
|--- | |||
| [[File:human_nose_survey.png|400px]] || [[File:human_nose_expertise.png|400px]] || [[File:human_nose_author.png|400px]] | |||
|--- | |||
| [[File:human_smell_survey.png|400px]] || [[File:human_smell_expertise.png|400px]] || [[File:human_smell_author.png|400px]] | |||
|--- | |||
| [[File:human_webbing_survey.png|400px]] || [[File:human_webbing_expertise.png|400px]] || | |||
|--- | |||
| [[File:human_eccrine_glands_survey.png|400px]] || [[File:human_eccrine_glands_expertise.png|400px]] || | |||
|--- | |||
| [[File:human_sweating_survey.png|400px]] || [[File:human_sweating_expertise.png|400px]] || [[File:human_sweating_author.png|400px]] | |||
|--- | |||
| [[File:human_diving-o_survey.png|400px]] || [[File:human_diving-o_expertise.png|400px]] || [[File:human_diving-o_author.png|400px]] | |||
|--- | |||
| [[File:human_apnea_survey.png|400px]] || [[File:human_apnea_expertise.png|400px]] || | |||
|--- | |||
|[[File:human_fond_of_water_survey.png|400px]] || [[File:human_fond_of_water_expertise.png|400px]] || | |||
|} | |||
===Survey=== | ===Survey=== | ||
| Line 152: | Line 306: | ||
The graph above shows the results for correlations done from the survey answers between all different hypotheses. In most cases the correlations were quite small, and almost always positive. There are only a few negative correlations in these answers, and in them the correlations are very small, -0.14 being the strongest negative correlation. The most notable correlations are between the hypotheses that suggest a semi-aquatic ancestor. If one believes in one, then all the water-relates hypotheses seem likely, and if one doesn't, they seem unlikely. Interestingly, eating of fish and other sea food enabling brain growth does not correlate with the rest of the water-related hypotheses, even though if fish was needed for brain growth, it indicades humans lived on shores, fishing and wading, thus probably spending a significant time in water, which is also the basis for all the other waterside hypotheses. The fish hypothesis does however have a correlation with eating meat being a major step toward bigger brains, as well as cooking the food, which makes it possible to get more energy from it. | The graph above shows the results for correlations done from the survey answers between all different hypotheses. In most cases the correlations were quite small, and almost always positive. There are only a few negative correlations in these answers, and in them the correlations are very small, -0.14 being the strongest negative correlation. The most notable correlations are between the hypotheses that suggest a semi-aquatic ancestor. If one believes in one, then all the water-relates hypotheses seem likely, and if one doesn't, they seem unlikely. Interestingly, eating of fish and other sea food enabling brain growth does not correlate with the rest of the water-related hypotheses, even though if fish was needed for brain growth, it indicades humans lived on shores, fishing and wading, thus probably spending a significant time in water, which is also the basis for all the other waterside hypotheses. The fish hypothesis does however have a correlation with eating meat being a major step toward bigger brains, as well as cooking the food, which makes it possible to get more energy from it. | ||
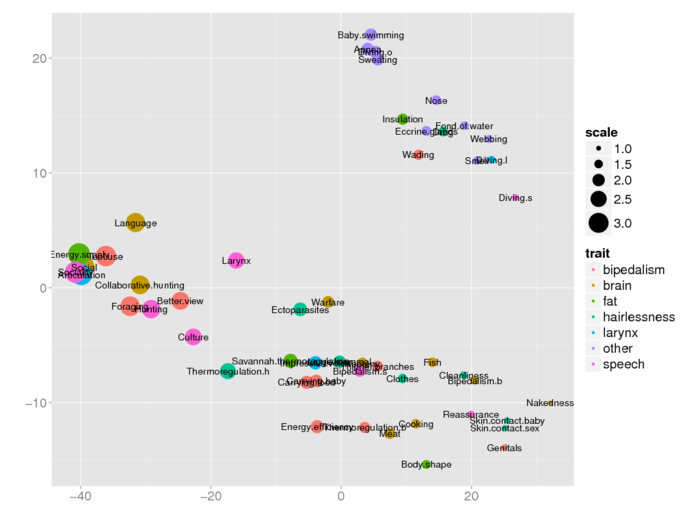
The graph below shows the results for principal components analysis done on the survey data. All the water-related hypotheses (except eating fish) are at the top right corner, and the rest are at the bottom. This means those people who have an opinion about one water-related hypothesis are more or less the same opinion about the rest of them. What people thought about the water-related hypotheses doesn't seem to have much of a connection to their opinions about the rest of the hypotheses. | |||
For other hypotheses it seems that the idea that brain developed as a response to hairlessness convinces the same people as the hypotheses of hairlessness evolving to enhance skin contact and bipedalism to show off genitals. Completely different people were the people who found it convincing that the brain developed to enable speaking or hunting and that the subcutaneous fat layer developed as an energy supply. | |||
The sizes for the dots tell about how likely the hypothesis was found to explain the trait in the survey. The bigger the dot, the more likely people thought it was. The numbers from the scaling were gotten by calculating the average answer (1 being very likely and 5 being very unlikely), and subtracting that from 5 (to get the likeliest ones with the highest values instead of the lowest). | |||
[[File:human_evolution_poca.png|700px]] | |||
===Literary review=== | ===Literary review=== | ||
Hidden below you can find a summary of the articles found in a literary review on the evolution of human traits done in the summer 2016 to find out, which hypothesis on which human traits are currently discussed in scientific articles, and which according to them seem the most likely ways the human traits have evolved. F, A and N in the last column stand for For, Against and Neutral, according to which point of view is argued in the article about the hypothesis in question. | Hidden below you can find a summary of the articles found in a literary review on the evolution of human traits done in the summer 2016 to find out, which hypothesis on which human traits are currently discussed in scientific articles, and which according to them seem the most likely ways the human traits have evolved. F, A and N in the last column stand for For, Against and Neutral, according to which point of view is argued in the article about the hypothesis in question. | ||
| Line 347: | Line 501: | ||
}} | }} | ||
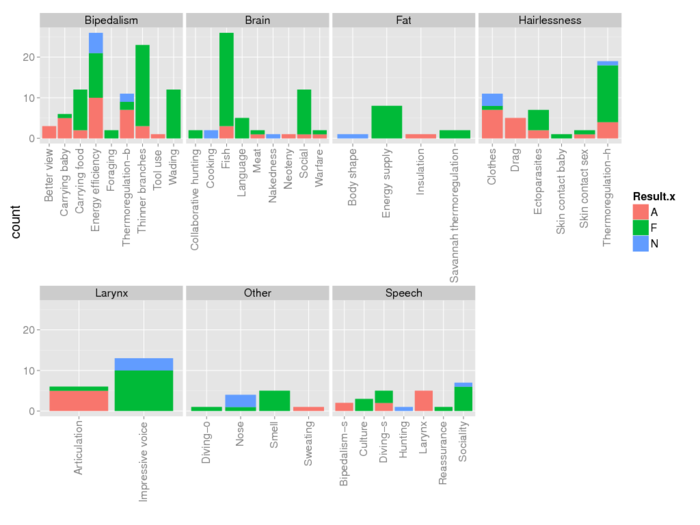
There are may histograms drawn from the review data to show how many of the found articles support or argue against all of the different hypotheses. They also show which hypotheses are the most talked about in the literature. Another set of histograms were drawn from the amount of authors writing the articles about each of the hypotheses. For this, all the authors for all articles were listed and plotted the same way as he articles, being for, against or writing something neural about the hypothesis. Before drawing the histograms the data was processed so that one author was counted only once to support or oppose a certain hypothesis, even if they had authored more than one article on the topic. You can see the histograms by authors | There are may histograms drawn from the review data to show how many of the found articles support or argue against all of the different hypotheses. They also show which hypotheses are the most talked about in the literature. Another set of histograms were drawn from the amount of authors writing the articles about each of the hypotheses. For this, all the authors for all articles were listed and plotted the same way as he articles, being for, against or writing something neural about the hypothesis. Before drawing the histograms the data was processed so that one author was counted only once to support or oppose a certain hypothesis, even if they had authored more than one article on the topic. You can see the histograms by trait from the authors below. Green color means supporting, red opposing and blue writing something neutral about the topic. All of the histograms can be found [http://en.opasnet.org/en-opwiki/index.php?title=Special:RTools&id=SzNHyHUMgpeJgNnn here] and [http://en.opasnet.org/en-opwiki/index.php?title=Special:RTools&id=gGXQ8bD1mlQe1QJD here]. Note that not all of the hypotheses in the survey were discussed at all in any of the articles in the literature review. | ||
[[File:human_evolution_authors_all.png|700px]] | |||
[[File:Graph of human trait evolution hypotheses.png|600px]] | |||
The lower graph above shows relations between writers (small dots) and hypotheses (bubbles), or how the different writers wrote about hypotheses. Green lines mean supporting, red lines mean arguing against, and grey lines mean writing something on the topic, but not being clearly for or against the hypothesis. It shows us which hypotheses are discussed by the same authors, and whether the author supported both, opposed both, or whether they're hypotheses that one person doesn't think likely to both be true. | |||
Several observations can be made from the graph. First, most authors only discussed a single hypothesis. The maximum number of different hypothesis discussed by a single author was six {{comment|# |CHECK THE DATA|--[[User:Jouni|Jouni]] ([[User talk:Jouni|talk]]) 12:48, 4 September 2016 (UTC)}}, but few authors discussed more than two hypotheses. | |||
Second, some areas, notably nakedness, stimulated many authors to discuss several possible hypotheses. Another similar area was bipedalism, where, interestingly, authors supporting thinner branch hypothesis simultaneously opposed energy efficiency hypothesis. However, in the survey data these two hypotheses were not correlated. | |||
Third, there are some isolated hypotheses such as neoteny, culture, and impressive voice, where the authors of these topics did not discuss any of the other hypotheses, and also none of the other authors discussed these hypotheses. | |||
It can be concluded that there is no single study that would systematically look at the evolution of important human traits and evaluate strengths and weaknesses of related hypotheses. | |||
=== Student survey === | |||
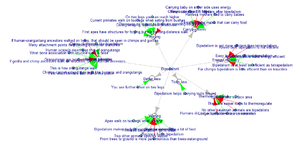
[[File:Bipedalism student survey.png|300px|thumb|Hypotheses and reasonings related to bipedalism.]]A questionnaire was sent to students to study whether they found the reasoning of each hypothesis convincing. | |||
{{hidden| | |||
<t2b name="Student survey" index="Trait,Hypothesis,Reasoning" obs="For Against Neutral" unit="-"> | |||
Bipedalism|Better view|You see further when on two legs|F | |||
Bipedalism|Carrying items|Chimps carry food in hands|F | |||
Bipedalism|Carrying items|Females prefer males that can carry food|F | |||
Bipedalism|Carrying items|Hairless mothers had to carry babies|F | |||
Bipedalism|Carrying items|Carrying baby on either side uses energy|A | |||
Bipedalism|Carrying items|First tools date 1.5 M years after bipedalism|A | |||
Bipedalism|Energy efficiency|Knuckle walk is least energy efficient|F | |||
Bipedalism|Energy efficiency|Bipedalism is at least as efficient as tetrapedalism|F | |||
Bipedalism|Energy efficiency|Easy to develop efficient bipedalism|F | |||
Bipedalism|Energy efficiency|For chimps bipedalism is less efficient than on knuckles|A | |||
Bipedalism|Energy efficiency|Bipedalism is not more efficient than tetrapedalism|A | |||
Bipedalism|Energy efficiency|Knees-bent bipedalism is not efficient|A | |||
Bipedalism|Foraging|Current primates walk on two legs when eating from bushes|F | |||
Bipedalism|Foraging|First apes have structures for forging but not for long-distance walk|F | |||
Bipedalism|Foraging|On two legs you can reach higher|F | |||
Bipedalism|Foraging|During foraging, bipedalism is efficient|F | |||
Bipedalism|Foraging|There was no reason to focus on standing-height foods|A | |||
Bipedalism|Thermoregulation-b|Smaller surface area|F | |||
Bipedalism|Thermoregulation-b|Longer operation times on savannah|F | |||
Bipedalism|Thermoregulation-b|No other savannah animals are bipedalists|A | |||
Bipedalism|Thermoregulation-b|There are easier ways to thermoregulate|A | |||
Bipedalism|Thermoregulation-b|Humans did not actually develop on savannah|A | |||
Bipedalism|Thinner branches|This is how orangutangs walk|F | |||
Bipedalism|Thinner branches|Chimps cannot extend their legs like humans and orangutangs|F | |||
Bipedalism|Thinner branches|Human scapula resembles that of orangutangs|F | |||
Bipedalism|Thinner branches|Chimp climbing is like bipedalism|F | |||
Bipedalism|Thinner branches|Many attachment points help moving on thinner branches|F | |||
Bipedalism|Thinner branches|First erect humans had thumb-like pollux|F | |||
Bipedalism|Thinner branches|Wrist bone association with knuckle walk is false|F | |||
Bipedalism|Thinner branches|If gorilla and chimp ancestors walk on knuckles, so did human ancestors|A | |||
Bipedalism|Thinner branches|Orangutangs are poor walkers on two legs.|A | |||
Bipedalism|Thinner branches|If human-oranguntang ancestors walked on trees, that should be seen in chimps and gorillas|A | |||
Bipedalism|Tools use|Bipedalism helps carrying tools around|F | |||
Bipedalism|Wading|Apes walk on two legs when wading|F | |||
Bipedalism|Wading|Two other primate species waded|F | |||
Bipedalism|Wading|Shallow waters offer a lot of food|F | |||
Bipedalism|Wading|Boyance helps bipedalism|F | |||
Bipedalism|Wading|Bipedalism makes body streamlined for swimming|F | |||
Bipedalism|Wading|Primates usually don't go to water|A | |||
Bipedalism|Wading|From trees to ground is more parsimonious than trees-water-ground|A | |||
</t2b> | |||
}} | |||
<rcode graphics=1> | |||
library(OpasnetUtils) | |||
library(ggplot2) | |||
library(igraph) | |||
dat <- opbase.data("Op_en5865",subset="Student survey") | |||
#order <- c("F", "N", "A") | |||
#dat$Result <- factor(dat$Result, levels=order) | |||
for(i in 1:ncol(dat)) {dat[[i]] <- as.character(dat[[i]])} | |||
edg <- data.frame( | |||
from = c(dat$Reasoning, dat$Trait), | |||
to = rep(dat$Hypothesis, 2), | |||
Etype = c(rep("If then", nrow(dat)), rep("Makes relevant", nrow(dat))), | |||
FAN = c(dat$Result, rep("", nrow(dat))) | |||
) | |||
edg <- edg[!duplicated(paste(edg$from, edg$to)) , ] | |||
ver <- data.frame( | |||
name = c(dat$Reasoning, dat$Trait, dat$Hypothesis), | |||
Vtype = rep(c("Reasoning", "Trait", "Hypothesis"), each = nrow(dat)) | |||
) | |||
ver <- ver[!duplicated(ver$name) , ] | |||
dag <- graph.data.frame(edg, directed = TRUE, vertices = ver) | |||
colo <- c("Red", "Blue", "Pink", "Orange", "Brown", "Yellow", "Purple") | |||
[[ | plot( | ||
dag, | |||
vertex.label.cex = 0.8, | |||
vertex.size = ifelse(V(dag)$Vtype == "Hypothesis", 6, 3), | |||
vertex.label.family = "Helvetica", | |||
vertex.color = ifelse(V(dag)$Vtype == "Hypothesis", | |||
colo[as.factor(V(dag)$Trait)], | |||
"SkyBlue2" | |||
), | |||
vertex.label = V(dag)$name, #ifelse(V(dag)$Vtype == "Hypothesis", V(dag)$name, NA), | |||
edge.color = c("Gray", "Red", "Green")[as.factor(E(dag)$FAN)], | |||
edge.arrow.size = 0.3, | |||
layout = layout.fruchterman.reingold, | |||
asp = 0.7 | |||
) | |||
</rcode> | |||
=== Calculations === | === Calculations === | ||
| Line 541: | Line 803: | ||
'''A code for drawing histograms from the literary review data showing the number of articles and and authors supporting and arguing against different hypotheses. | '''A code for drawing histograms from the literary review data showing the number of articles and and authors supporting and arguing against different hypotheses. | ||
You can see all the histograms by clicking "Run code". | You can see all the histograms by clicking "Run code". | ||
* Model run [http://en.opasnet.org/en-opwiki/index.php?title=Special:RTools&id=fCPaFIASXqpRCjW5 13.9.2016] | |||
<rcode graphics="1"> | <rcode graphics="1"> | ||
| Line 549: | Line 812: | ||
authors <- opbase.data("Op_en5865",subset="Literary review authors") | authors <- opbase.data("Op_en5865",subset="Literary review authors") | ||
authors_summary <- merge(summary_data, authors,by="Article") # Merged tables | authors_summary <- merge(summary_data, authors,by="Article") # Merged tables | ||
authors_short <- authors_summary[,c("Trait","Hypothesis","Result.x","Result.y")] # Irrelevant columns taken out | authors_short <- authors_summary[,c("Trait","Hypothesis","Result.x","Result.y")] # Irrelevant columns taken out | ||
authors_uniq <- unique(authors_short) # A list of authors only defending of attacking one hypothesis once. | authors_uniq <- unique(authors_short) # A list of authors only defending of attacking one hypothesis once. | ||
#ggplot(data=summary_data, aes(summary_data$Result)) + geom_histogram() | #ggplot(data=summary_data, aes(summary_data$Result)) + geom_histogram() | ||
ggplot(summary_data, aes(Result, fill = Hypothesis)) + geom_histogram() # eri hypoteesit eri värillä | #ggplot(summary_data, aes(Result, fill = Hypothesis)) + geom_histogram() # eri hypoteesit eri värillä | ||
ggplot(summary_data, aes(Hypothesis, fill = Result)) + geom_histogram() # F/A/N eri värillä hypoteeseittain. | #ggplot(summary_data, aes(Hypothesis, fill = Result)) + geom_histogram() # F/A/N eri värillä hypoteeseittain. | ||
hypothesis.order <- c("Tool use","Foraging","Better view","Energy efficiency","Carrying baby","Carrying food","Thermoregulation-b","Wading","Thinner branches","Genitals","Social","Language","Collaborative hunting","Warfare","Meat","Neoteny","Fish","Cooking","Bipedalism-b","Nakedness","Thermoregulation-h","Ectoparasites","Large mammal","Clothes","Drag","Cleanliness","Skin contact sex","Skin contact baby","Energy supply","Savannah thermoregulation","Insulation","Body shape","Articulation","Impressive voice","Diving-l","Sociality","Hunting","Culture","Larynx","Bipedalism-s","Reassurance","Diving-s","Baby swimming","Sweating","Diving-o","Apnea","Nose","Fond of water","Smell","Webbing","Eccrine glands") | |||
authors_uniq$Hypothesis <- factor(authors_uniq$Hypothesis, levels=hypothesis.order) | |||
# | ## histograms per trait in articles | ||
for(i in unique(summary_data$Trait)){ | |||
trait2 <- ggplot(summary_data[summary_data$Trait == i,], aes(Hypothesis, fill = Result)) + | |||
geom_histogram() + | |||
labs(x="", y="Count", title= paste(i, "in articles")) + | |||
theme_grey(base_size=24) | |||
print(trait2) | |||
} | |||
## histograms per trait by author | |||
for(i in unique(authors_uniq$Trait)){ | |||
authors2 <- ggplot(authors_uniq[authors_uniq$Trait == i,], aes(Hypothesis, fill = Result.x)) + | |||
geom_histogram() + | |||
labs(x="", y="Count", title= paste(i, "by author")) + | |||
theme_grey(base_size=24) | |||
print(authors2) | |||
} | |||
order <- c("F", "N", "A") | |||
authors_uniq$Result.x <- factor(authors_uniq$Result.x, levels=order) | |||
summary_data$Result <- factor(summary_data$Result, levels=order) | |||
# | ## Histograms wrapped by trait in articles | ||
for(i in unique(summary_data$Trait)) { | |||
trait <- ggplot(summary_data[summary_data$Trait == i,], aes(Result)) + | |||
geom_histogram(fill="blue") + | |||
labs(x = "", y = "count", title = paste(i, " in articles")) + | |||
theme_grey(base_size=24) + | |||
facet_wrap(~Hypothesis) | |||
print(trait) | |||
} | |||
## Histograms wrapped by trait by authors | |||
for(i in unique(authors_uniq$Trait)) { | |||
authors <- ggplot(authors_uniq[authors_uniq$Trait == i,], aes(Result.x)) + | |||
geom_histogram(fill="blue") + | |||
labs(x="", y="Count", title = paste(i, " by author")) + | |||
theme_grey(base_size=24) + | |||
facet_wrap(~Hypothesis) | |||
print(authors) | |||
} | |||
###Summary graphs | |||
authors_all <- ggplot(authors_uniq, aes (Hypothesis, fill = Result.x)) + geom_histogram() + labs(x="", y="count") + theme_grey(base_size=20) + theme(axis.text.x=element_text(angle=90,hjust=1,vjust=0.4)) | |||
authors_all + facet_wrap(~Trait, ncol=4, scales="free_x") | |||
#all <- ggplot(summary_data, aes(Hypothesis, fill=Result)) + geom_histogram() + labs(x="", y="count") | |||
#all + facet_wrap(~Trait, ncol=4, scales="free_x) | |||
# | ## All hypotheses separately | ||
for(i in unique(authors_uniq$Hypothesis)) { | |||
authors_uniq$weight <- ifelse(authors_uniq$Hypothesis == i, 1, 0) | |||
temp <- ggplot(authors_uniq, aes(x=Result.x, weight=weight)) + | |||
geom_bar(fill="blue") + | |||
labs(x = "", y = "count", title = paste(i, " by authors")) + | |||
theme_grey(base_size=24) + | |||
coord_cartesian(ylim = c(0, 25)) | |||
print(temp) | |||
} | |||
#oprint(odag) | #oprint(odag) | ||
| Line 694: | Line 918: | ||
#odag() | #odag() | ||
authors_for <- authors_uniq[authors_uniq$Result.x == "F",] | #authors_for <- authors_uniq[authors_uniq$Result.x == "F",] | ||
oprint(authors_for) | #oprint(authors_for) | ||
authors_against <- authors_uniq[authors_uniq$Result.x == "A",] | #authors_against <- authors_uniq[authors_uniq$Result.x == "A",] | ||
oprint(authors_against) | #oprint(authors_against) | ||
edg <- data.frame( | edg <- data.frame( | ||
| Line 729: | Line 953: | ||
dag, | dag, | ||
vertex.label.cex = 0.4, | vertex.label.cex = 0.4, | ||
vertex.size = ifelse(V(dag)$Type == "Hypothesis", 6, 3),, | vertex.size = ifelse(V(dag)$Type == "Hypothesis", 6, 3), | ||
vertex.label.family = "Helvetica", | |||
vertex.color = ifelse(V(dag)$Type == "Hypothesis", | vertex.color = ifelse(V(dag)$Type == "Hypothesis", | ||
colo[as.factor(V(dag)$Trait)], | colo[as.factor(V(dag)$Trait)], | ||
| Line 740: | Line 965: | ||
asp = 0.7 | asp = 0.7 | ||
) | ) | ||
</rcode> | </rcode> | ||
== See also == | == See also == | ||
[[How scientists perceive the evolutionary origin of human traits: results of a survey study]] | |||
Human evolution hypotheses described in [[Wikipedia]]: | Human evolution hypotheses described in [[Wikipedia]]: | ||
Latest revision as of 06:43, 27 April 2018
| Moderator:Hanna (see all) |
|
|
| Upload data
|
Evolutionary origin of human traits is a variable page about the topic. For a survey study looking at researchers' opinions about this topic, see How scientists perceive the evolutionary origin of human traits: results of a survey study
Question
Why and how did humans become so different from other apes?
Answer
Rationale
Hypotheses
There are conflicting hypotheses to explain why the traits that so clearly distinguish humans from other primates originally evolved. One idea is that the ancestors of humans came to live in a different kind of environment than the ancestors of chimpanzees and gorillas, and hence experienced different selection pressures and obtained a suite of unique traits as adaptations to the new environment. What that new environment was and which selection pressures were most important has been debated, however, and a number of hypotheses based on ideas other than environmental adaptation have also been proposed. To date, general discussion on the topic seems mostly to have focused on finding merit or flaws in one hypothesis at a time. The purpose of this page is to provide a structured forum for the general evaluation and comparison of the different hypotheses on human origins.
Below you can find a list of hypotheses explaining different traits that separate humans from other great apes. They were a part of a survey done on people's understanding about the reasons behind human traits, answered by paleontologist, biologists, medical professionals, and other people with professional understanding about evolution (human or in general) or how human bodies work. Some analysis done on the survey answers can be found below. Some hypotheses much discussed in literature in the last years are missing from the survey (and thus he list below), such as the postural feeding hypothesis, stating bipedalism originally arose as a feeding posture and not as a way of locomotion, and the expensive tissue hypothesis, which suggests the energy needed for building a big brain came from reducing some other expensive tissue in our body, namely the gut. A literary review was done on the same hypotheses asked about in the survey to find out whether the understanding about human evolution the answerers had was the same that could be gotten from scientific literature published in the last decades. Some analysis on the literary review results is found on this page.
The short version of the hypotheses in the list below are the ones used to refer to them in the analysis.
| For short | Hypothesis |
|---|---|
| Bipedalism | |
| Energy efficiency | When covering long distances on the ground, walking or running erect on two legs is energetically more efficient than walking or running on four legs. |
| Thinner branches | In the canopy, walking erect facilitates using multiple supports (as in orangutans) and hence makes it possible to move on thinner branches than when brachiating or moving quadrupedally. |
| Wading | In a littoral habitat, walking erect allows wading in deeper water with the nostrils above the surface (apes cross water bodies bipedally), and the same posture increases streamlining when swimming and diving for food (as in penguins). |
| Thermoregulation-b | Walking erect helps in thermoregulation in the savanna by exposing less skin to the midday sun and more skin to cooling wind. |
| Better view | Walking erect makes it possible to see above the savanna grass and hence spot danger from further away. |
| Foraging | Walking erect makes foraging more efficient, because hands are not needed for locomotion. |
| Carrying food | Walking erect makes it easier for a male to carry high-quality food such as meat to the female and infants. |
| Carrying baby | Walking erect makes it possible for a female to carry its offspring in its arms. |
| Tool use | Walking erect makes it easier to use tools and weapons. |
| Genitals | Walking erect is favored by sexual selection, as it makes the genitals more visible. |
| Big brain | |
| Meat | A shift in diet towards eating more meat triggers encephalization, because meat is rich in energy. |
| Fish | A shift in diet towards eating more fish and other seafood triggers encephalization, because seafood is rich in both energy and the omega-3 fatty acids that are an essential component of brain tissue. |
| Cooking | The use of fire triggers encephalization, because cooking increases the nutritional value of plant foods. |
| Social | Complex social organization causes pressure for greater intelligence and hence triggers encephalization. |
| Collaborative hunting | Collaborative hunting causes pressure for greater intelligence and hence triggers encephalization. |
| Language | Spoken language causes pressure for greater intelligence and hence triggers encephalization. |
| Warfare | Warfare causes pressure for greater intelligence and hence triggers encephalization. |
| Neoteny | Encephalization is a secondary effect of neoteny (the retention of juvenile features into adulthood), which is advantageous when specialized adult morphology adapted to one environment has become maladaptive in a new environment. |
| Bipedalism-b | Encephalization is triggered by bipedalism, which changes the blood circulation and provides a cooling mechanism for the larger brain. |
| Nakedness | Encephalization is triggered by nakedness, which provides a cooling mechanism for the larger brain. |
| Nakedness | |
| Skin contact baby | Direct skin-to-skin contact strengthens the emotional bond between a female and its nursing offspring. |
| Skin contact sex | Direct skin-to-skin contact makes sex more enjoyable, and is favored by sexual selection. |
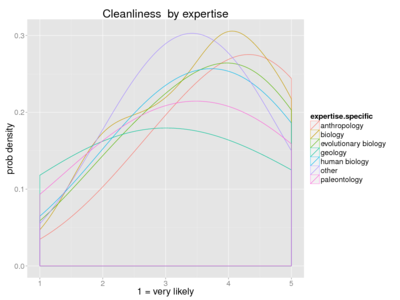
| Cleanliness | In animals that feed messily on carrion, naked skin stays cleaner than hairy skin (or feather-covered skin as in vultures). |
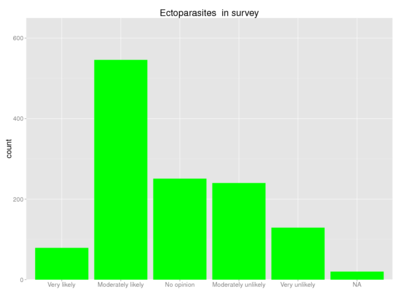
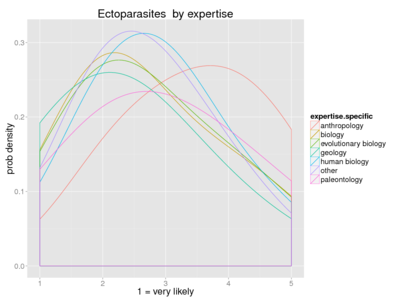
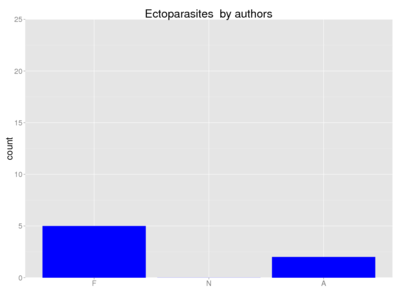
| Ectoparasites | In mammals that live in permanent nests, naked skin helps to avoid a high ectoparasite load. |
| Drag | In mammals that live partly or entirely entirely in water, fur is often lost because it causes drag when swimming but fails to provide efficient insulation when wet (e.g. walrus, hippopotamuses, dolphins). |
| Thermoregulation-h | In mammals that hunt on the savanna, naked skin dissipates heat more efficiently and reduces the risk of becoming overheated. |
| Large mammal | Large mammals can regulate their body temperature without investing in hair, and humans are relatively large compared to other primates. |
| Clothes | Once the use of clothes has become common, fur becomes unnecessary. |
| Subcutaneous fat | |
| Energy supply | In conditions of variable food supply, subcutaneous fat can store energy for times of food scarcity, and in infants it secures the development of the large brain. |
| Insulation | In wet conditions, subcutaneous fat provides more efficient insulation than hair does, and it makes swimming easier by increasing buoyancy and streamlining of the body. |
| Savannah thermoregulation | Subcutaneous fat is an adaptation to thermoregulation in the savanna, together with nakedness and sweating. |
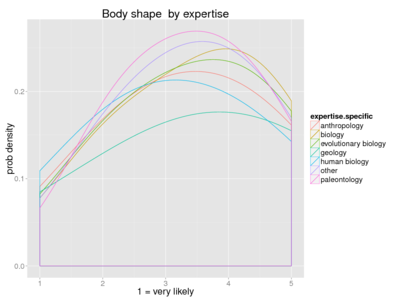
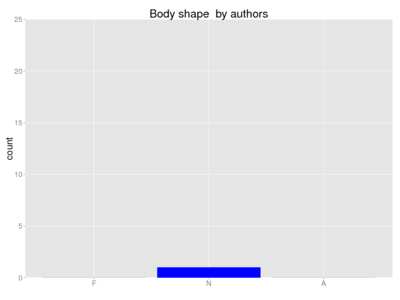
| Body shape | Subcutaneous fat defines the body shape and its evolution is driven by sexual selection. |
| Descended larynx | |
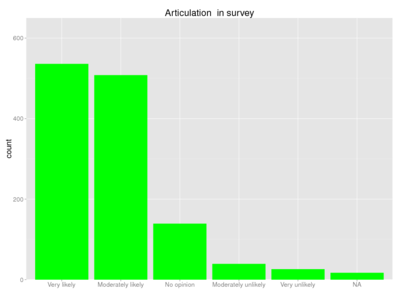
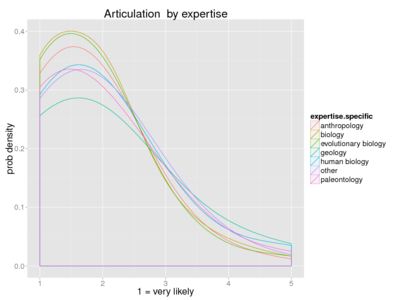
| Articulation | Articulate speech requires a descended larynx, because this makes it possible to produce a wider variety of sounds. |
| Impressive voice | A descended larynx makes the voice stronger and more impressive, and can evolve through sexual selection (as in the males of some deer). |
| Diving-l | A descended larynx can evolve as an adaptation to diving (as in some aquatic mammals), because it makes it possible to close the air passages when under water and to inhale rapidly through the mouth when surfacing. |
| Speech | |
| Larynx | Speech is triggered by the descended larynx, which allows making a wider variety of sounds. |
| Diving-s | Speech requires voluntary breath control, which can evolve as an adaptation to diving. In water, visual and olfactory cues are inadequate and therefore liable to be replaced by vocal communication (as in whales). |
| Bipedalism-s | Speech requires voluntary breath control, which can evolve after bipedalism frees breathing from the constraint posed by the mechanics of locomotion. |
| Reassurance | Speech provides a means for females to reassure their offspring who have to be put down while foraging. |
| Sociality | Social pressure for more elaborate communication triggers evolution of speech. |
| Hunting | Collective hunting requires a means of effective communication and therefore triggers evolution of speech. |
| Culture | Transmitting cultural tradition (e.g., how to cope with unusually severe droughts) from one generation to the next requires a means of effective communication and therefore triggers evolution of speech. |
| Other traits that could be explained by an aquatic phase in human evolution | |
| Baby swimming | Human babies can be taken for a swim long before they can walk. They are comfortable in water and capable of holding their breath when submerged. |
| Nose | Unlike apes, humans have an arched nose and flexible nostrils. These help prevent water from entering the respiratory tract when diving. |
| Smell | Humans have a relatively weak sense of smell, as aquatic mammals often do. |
| Webbing | Humans have partial webbing between their fingers and toes. Webbed feet are common among semi-aquatic animals (such as otters and ducks), but are not found in non-human primates. |
| Eccrine glands | Cooling sweat is excreted from eccrine glands in humans but from apocrine glands in other primates. Apocrine glands could have lost their thermoregulatory function in human ancestors during a period when dip-cooling replaced sweat-cooling. |
| Sweating | Humans sweat more profusely than any other primate. Since this can lead to fatal loss of water and electrolytes in a few hours, the trait probably evolved in conditions of abundant water and salt supply. |
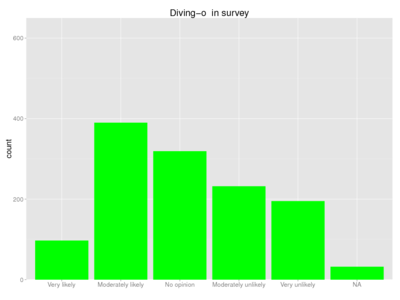
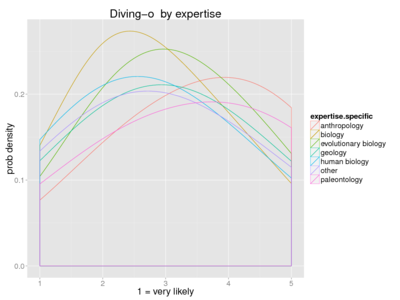
| Diving-o | Compared to other primates, humans are stronger swimmers and can dive both deeper and further. |
| Apnea | The diving reflex (slowing down of heartbeat and oxygen usage in water) increases the resistance of the brain to apnea, and its magnitude in human divers is comparable to that in semi-aquatic mammals such as otters and beavers. |
| Fond of water | Compared to other primates, humans are unusually fond of immersing themselves in water. This is manifested in the popularity of beach holidays, swimming and bathing. |
The answerers' opinions should be used as continuous [0,1] variables in such a way that each answer is transformed into its quantile of all answers to that question. Then neural networks, Bayesian belief network analyzers (such as B-source), or other statistical tools can be applied.
For single answer analyses, multinomial regression models should be applied.
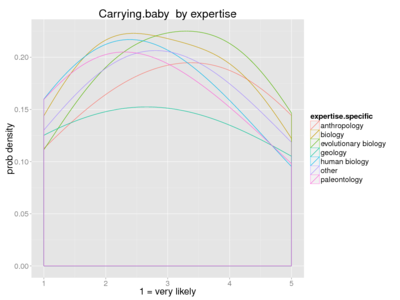
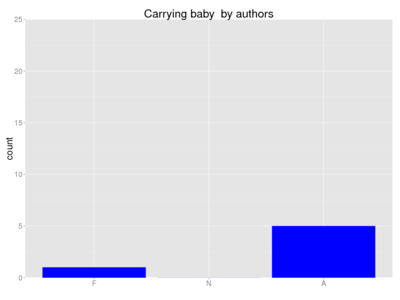
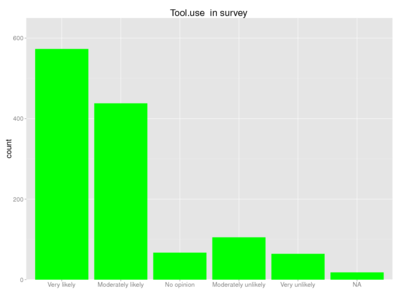
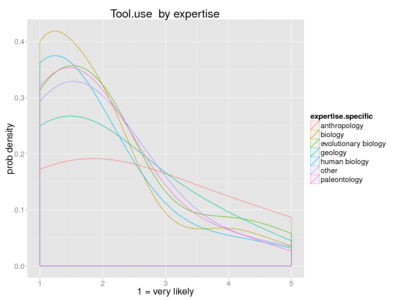
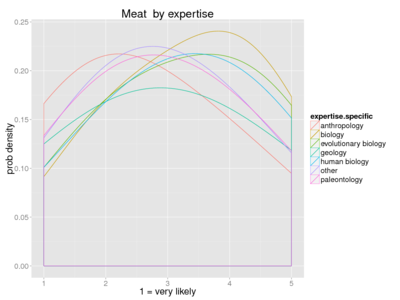
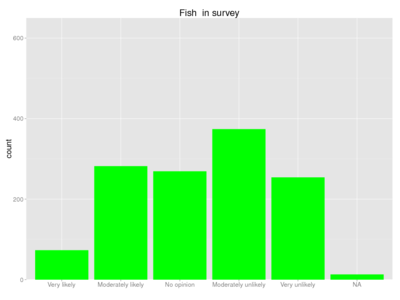
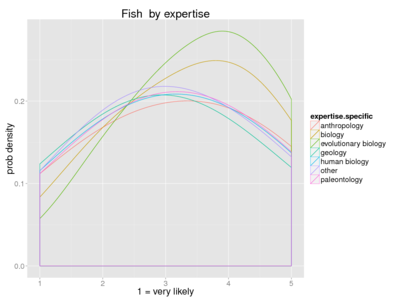
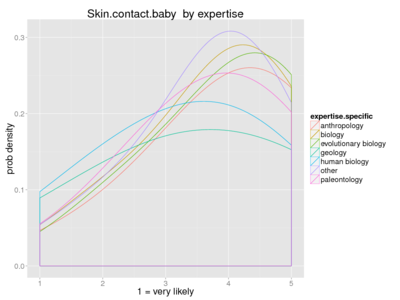
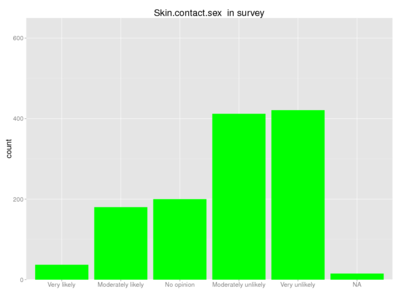
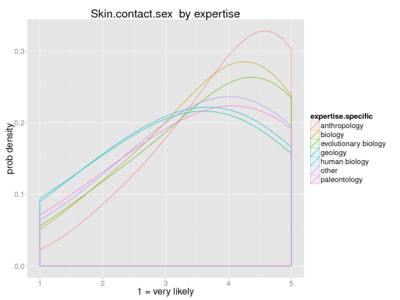
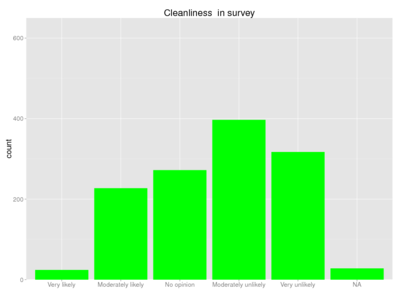
In the following sections, we will present results about support to different hypotheses explaining the traits studied. We have two sources of information and three graphs for each hypothesis: Survey to authors of relevant journals, with ca. 1200 responses; and authors of articles about human evolution and the traits of interest (272 individual authors). The survey graphs on the left show the repondents' views on how likely each hypothesis is. The middle graphs show the same information separated by the expertise of the respondent (and for visibility, we assumed the X axis to be continous so that we could draw probability densities). The graphs on the right show the support from article authors in the literature review. Each hypothesis has one row of graphs, and they are ordered by the trait the hypotheses explain.
Bipedalism
| Show details | ||
|---|---|---|
 |
 |
|
 |
 |
|
 |
 |
|
 |
 |
|
 |
 |
|
 |
 |
|
 |
 |
|
 |
 |
|
 |
 |
|
 |
 |
Brain
| Show details | ||
|---|---|---|
 |
 |
|
 |
 |
|
 |
 |
|
 |
 |
|
 |
 |

|
 |
 |
|
 |
 |
|
 |
 |
|
 |
 |
|
 |
 |
|
Nakedness
| Show details | ||
|---|---|---|
 |
 |

|
 |
 |

|
 |
 |
|
 |
 |
|
 |
 |
|
 |
 |
|
 |
 |
|
 |
 |
|
Subcutaneous fat
| Show details | ||
|---|---|---|
 |
 |
|
 |
 |
|
 |
 |

|
 |
 |
|
Larynx
| Show details | ||
|---|---|---|
 |
 |
|
 |
 |
|
 |
 |
Speech
| Show details | ||
|---|---|---|
 |
 |
|
 |
 |
|
 |
 |
|
 |
 |
|
 |
 |
|
 |
 |
|
 |
 |
|
Other traits
| Show details | ||
|---|---|---|
 |
 |
|
 |
 |
|
 |
 |
|
 |
 |
|
 |
 |
|
 |
 |
|
 |
 |
|
 |
 |
|
 |
 |
Survey
The graph above shows the results for correlations done from the survey answers between all different hypotheses. In most cases the correlations were quite small, and almost always positive. There are only a few negative correlations in these answers, and in them the correlations are very small, -0.14 being the strongest negative correlation. The most notable correlations are between the hypotheses that suggest a semi-aquatic ancestor. If one believes in one, then all the water-relates hypotheses seem likely, and if one doesn't, they seem unlikely. Interestingly, eating of fish and other sea food enabling brain growth does not correlate with the rest of the water-related hypotheses, even though if fish was needed for brain growth, it indicades humans lived on shores, fishing and wading, thus probably spending a significant time in water, which is also the basis for all the other waterside hypotheses. The fish hypothesis does however have a correlation with eating meat being a major step toward bigger brains, as well as cooking the food, which makes it possible to get more energy from it.
The graph below shows the results for principal components analysis done on the survey data. All the water-related hypotheses (except eating fish) are at the top right corner, and the rest are at the bottom. This means those people who have an opinion about one water-related hypothesis are more or less the same opinion about the rest of them. What people thought about the water-related hypotheses doesn't seem to have much of a connection to their opinions about the rest of the hypotheses.
For other hypotheses it seems that the idea that brain developed as a response to hairlessness convinces the same people as the hypotheses of hairlessness evolving to enhance skin contact and bipedalism to show off genitals. Completely different people were the people who found it convincing that the brain developed to enable speaking or hunting and that the subcutaneous fat layer developed as an energy supply.
The sizes for the dots tell about how likely the hypothesis was found to explain the trait in the survey. The bigger the dot, the more likely people thought it was. The numbers from the scaling were gotten by calculating the average answer (1 being very likely and 5 being very unlikely), and subtracting that from 5 (to get the likeliest ones with the highest values instead of the lowest).
Literary review
Hidden below you can find a summary of the articles found in a literary review on the evolution of human traits done in the summer 2016 to find out, which hypothesis on which human traits are currently discussed in scientific articles, and which according to them seem the most likely ways the human traits have evolved. F, A and N in the last column stand for For, Against and Neutral, according to which point of view is argued in the article about the hypothesis in question.
| Show details | |||||||||||||||||||||||||||||||||||||||||||||||||||||||||||||||||||||||||||||||||||||||||||||||||||||||||||||||||||||||||||||||||||||||||||||||||||||||||||||||||||||||||||||||||||||||||||||||||||||||||||||||||||||||||||||||||||||||||||||||||||||||||||||||||||||||||||||||||||||||||||||||||||||||||||||||||||||||||||||||||||||||||||||||||||||||||||||||||||||||||||||||||||||||||||||||||||||||||||||||||||||||||||||||||||||||||||||||||||||||||||||||||||||||||||||||||||||||||||||||||||||||||||||||||||||||||||||||||||||||||||||||||||||||||||||||||||||||||||||||||||||||||||||||||||||||||||||||||||||||||||||||||||||||||||||||||||||||||||||||||||||||||||||||||||||||||||||||||||||||||||||||||||||||||||||||||||||||||||||||||||||||||||||||||||||||||||||||||||||||||||||||||||||||||||||||||||||||||||||||||||||||||||||||||||||||||||||||||||||||||||||||||||||||||||||||||||||||||||||||||||||||||||||||||||||||||||||||||||||||||||||||||||||||||||||||||||||||||||||||||||||||||||||||||||||||||||||||||||||||
|---|---|---|---|---|---|---|---|---|---|---|---|---|---|---|---|---|---|---|---|---|---|---|---|---|---|---|---|---|---|---|---|---|---|---|---|---|---|---|---|---|---|---|---|---|---|---|---|---|---|---|---|---|---|---|---|---|---|---|---|---|---|---|---|---|---|---|---|---|---|---|---|---|---|---|---|---|---|---|---|---|---|---|---|---|---|---|---|---|---|---|---|---|---|---|---|---|---|---|---|---|---|---|---|---|---|---|---|---|---|---|---|---|---|---|---|---|---|---|---|---|---|---|---|---|---|---|---|---|---|---|---|---|---|---|---|---|---|---|---|---|---|---|---|---|---|---|---|---|---|---|---|---|---|---|---|---|---|---|---|---|---|---|---|---|---|---|---|---|---|---|---|---|---|---|---|---|---|---|---|---|---|---|---|---|---|---|---|---|---|---|---|---|---|---|---|---|---|---|---|---|---|---|---|---|---|---|---|---|---|---|---|---|---|---|---|---|---|---|---|---|---|---|---|---|---|---|---|---|---|---|---|---|---|---|---|---|---|---|---|---|---|---|---|---|---|---|---|---|---|---|---|---|---|---|---|---|---|---|---|---|---|---|---|---|---|---|---|---|---|---|---|---|---|---|---|---|---|---|---|---|---|---|---|---|---|---|---|---|---|---|---|---|---|---|---|---|---|---|---|---|---|---|---|---|---|---|---|---|---|---|---|---|---|---|---|---|---|---|---|---|---|---|---|---|---|---|---|---|---|---|---|---|---|---|---|---|---|---|---|---|---|---|---|---|---|---|---|---|---|---|---|---|---|---|---|---|---|---|---|---|---|---|---|---|---|---|---|---|---|---|---|---|---|---|---|---|---|---|---|---|---|---|---|---|---|---|---|---|---|---|---|---|---|---|---|---|---|---|---|---|---|---|---|---|---|---|---|---|---|---|---|---|---|---|---|---|---|---|---|---|---|---|---|---|---|---|---|---|---|---|---|---|---|---|---|---|---|---|---|---|---|---|---|---|---|---|---|---|---|---|---|---|---|---|---|---|---|---|---|---|---|---|---|---|---|---|---|---|---|---|---|---|---|---|---|---|---|---|---|---|---|---|---|---|---|---|---|---|---|---|---|---|---|---|---|---|---|---|---|---|---|---|---|---|---|---|---|---|---|---|---|---|---|---|---|---|---|---|---|---|---|---|---|---|---|---|---|---|---|---|---|---|---|---|---|---|---|---|---|---|---|---|---|---|---|---|---|---|---|---|---|---|---|---|---|---|---|---|---|---|---|---|---|---|---|---|---|---|---|---|---|---|---|---|---|---|---|---|---|---|---|---|---|---|---|---|---|---|---|---|---|---|---|---|---|---|---|---|---|---|---|---|---|---|---|---|---|---|---|---|---|---|---|---|---|---|---|---|---|---|---|---|---|---|---|---|---|---|---|---|---|---|---|---|---|---|---|---|---|---|---|---|---|---|---|---|---|---|---|---|---|---|---|---|---|---|---|---|---|---|---|---|---|---|---|---|---|---|---|---|---|---|---|---|---|---|---|---|---|---|---|---|---|---|---|---|---|---|---|---|---|---|---|---|---|---|---|---|---|---|---|---|---|---|---|---|---|---|---|---|---|---|---|---|---|---|---|---|---|---|---|---|---|---|---|---|---|---|---|---|---|---|---|---|---|---|---|---|---|---|---|---|---|---|---|---|---|---|---|---|---|---|---|---|---|---|---|---|---|---|---|---|---|---|---|---|---|---|---|---|---|---|---|---|---|---|---|---|---|---|---|---|---|---|---|---|---|---|---|---|---|---|---|---|---|---|---|---|---|---|---|---|---|---|---|---|---|---|---|---|---|---|---|---|---|---|---|---|---|---|---|---|---|---|---|---|---|---|---|---|---|---|---|---|---|---|---|---|---|---|---|---|---|---|---|---|---|---|---|---|---|---|---|---|---|---|---|---|---|---|---|---|---|---|---|---|---|---|---|---|---|---|---|---|---|---|---|---|---|---|---|---|---|---|---|---|---|---|---|---|---|---|---|---|---|---|---|---|---|---|---|---|---|---|---|---|---|---|---|---|---|---|---|---|---|---|---|---|---|---|---|---|---|---|---|---|---|---|---|---|---|---|---|---|---|---|---|---|---|---|---|---|---|---|---|---|---|---|---|---|---|---|---|---|---|---|---|---|---|---|---|---|---|---|---|---|---|---|---|---|---|---|---|---|---|---|---|---|---|---|---|---|---|---|---|---|---|---|---|---|---|---|---|---|---|---|---|---|---|
|
There are may histograms drawn from the review data to show how many of the found articles support or argue against all of the different hypotheses. They also show which hypotheses are the most talked about in the literature. Another set of histograms were drawn from the amount of authors writing the articles about each of the hypotheses. For this, all the authors for all articles were listed and plotted the same way as he articles, being for, against or writing something neural about the hypothesis. Before drawing the histograms the data was processed so that one author was counted only once to support or oppose a certain hypothesis, even if they had authored more than one article on the topic. You can see the histograms by trait from the authors below. Green color means supporting, red opposing and blue writing something neutral about the topic. All of the histograms can be found here and here. Note that not all of the hypotheses in the survey were discussed at all in any of the articles in the literature review.
The lower graph above shows relations between writers (small dots) and hypotheses (bubbles), or how the different writers wrote about hypotheses. Green lines mean supporting, red lines mean arguing against, and grey lines mean writing something on the topic, but not being clearly for or against the hypothesis. It shows us which hypotheses are discussed by the same authors, and whether the author supported both, opposed both, or whether they're hypotheses that one person doesn't think likely to both be true.
Several observations can be made from the graph. First, most authors only discussed a single hypothesis. The maximum number of different hypothesis discussed by a single author was six ----#: . CHECK THE DATA --Jouni (talk) 12:48, 4 September 2016 (UTC) (type: truth; paradigms: science: comment), but few authors discussed more than two hypotheses.
Second, some areas, notably nakedness, stimulated many authors to discuss several possible hypotheses. Another similar area was bipedalism, where, interestingly, authors supporting thinner branch hypothesis simultaneously opposed energy efficiency hypothesis. However, in the survey data these two hypotheses were not correlated.
Third, there are some isolated hypotheses such as neoteny, culture, and impressive voice, where the authors of these topics did not discuss any of the other hypotheses, and also none of the other authors discussed these hypotheses.
It can be concluded that there is no single study that would systematically look at the evolution of important human traits and evaluate strengths and weaknesses of related hypotheses.
Student survey
A questionnaire was sent to students to study whether they found the reasoning of each hypothesis convincing.
| Show details | |||||||||||||||||||||||||||||||||||||||||||||||||||||||||||||||||||||||||||||||||||||||||||||||||||||||||||||||||||||||||||||||||||||||||||||||||||||||||||||||||||||||||||||||||||||||||||||||||||||||||||||
|---|---|---|---|---|---|---|---|---|---|---|---|---|---|---|---|---|---|---|---|---|---|---|---|---|---|---|---|---|---|---|---|---|---|---|---|---|---|---|---|---|---|---|---|---|---|---|---|---|---|---|---|---|---|---|---|---|---|---|---|---|---|---|---|---|---|---|---|---|---|---|---|---|---|---|---|---|---|---|---|---|---|---|---|---|---|---|---|---|---|---|---|---|---|---|---|---|---|---|---|---|---|---|---|---|---|---|---|---|---|---|---|---|---|---|---|---|---|---|---|---|---|---|---|---|---|---|---|---|---|---|---|---|---|---|---|---|---|---|---|---|---|---|---|---|---|---|---|---|---|---|---|---|---|---|---|---|---|---|---|---|---|---|---|---|---|---|---|---|---|---|---|---|---|---|---|---|---|---|---|---|---|---|---|---|---|---|---|---|---|---|---|---|---|---|---|---|---|---|---|---|---|---|---|---|---|
|
Calculations
calc1
- Data version 1: raw data in Excel from Webropol: free text columns removed [1]
- Data version 2: cleaned with this code [http://en.opasnet.org/en-opwiki/index.php/Special:R-tools?id=
Histograms
A code for drawing histograms from the literary review data showing the number of articles and and authors supporting and arguing against different hypotheses. You can see all the histograms by clicking "Run code".
- Model run 13.9.2016
See also
How scientists perceive the evolutionary origin of human traits: results of a survey study
Human evolution hypotheses described in Wikipedia:
- Aquatic ape hypothesis
- Endurance running hypothesis
- Gathering hypothesis
- Hunting hypothesis
- Hypotheses explaining bipedalism
- Killer ape hypothesis
Keywords
Human evolution, Bipedalism, Brain, Hairnessless, Subcutaneous fat, Speech
References

