Uploads by Jouni
Jump to navigation
Jump to search
This special page shows all uploaded files.
| Date | Name | Thumbnail | Size | Description | Versions |
|---|---|---|---|---|---|
| 06:59, 31 August 2006 | NumberOfTrips.png (file) | 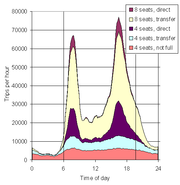 |
12 KB | Number of trips in composite traffic. Figure from Tuomisto and Tainio, BMC Public Health (2006) 5: 123. | 1 |
| 07:21, 31 August 2006 | Discussion.PNG (file) |  |
345 bytes | Discussion tag | 1 |
| 19:56, 17 September 2006 | Risk cycle.PNG (file) | 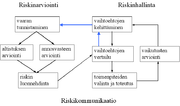 |
27 KB | Parts of risk analysis | 1 |
| 20:03, 17 September 2006 | Coal mining.PNG (file) | 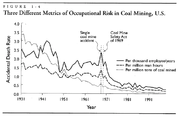 |
36 KB | Wilson&Crouch Figure 1-4. | 1 |
| 05:30, 18 September 2006 | Risk analysis cycle.PNG (file) | 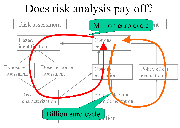 |
84 KB | Components of risk analysis and the million euro cycle. Source: Jouni Tuomisto, 2003. | 1 |
| 05:32, 18 September 2006 | Risk analysis cycle small.PNG (file) | 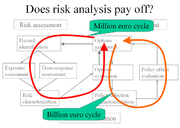 |
58 KB | Components of risk analysis and the million euro cycle. Source: Jouni Tuomisto, 2003. | 1 |
| 05:37, 18 September 2006 | Risk analysis small.PNG (file) | 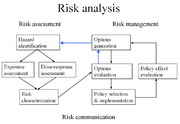 |
45 KB | 2 | |
| 05:41, 18 September 2006 | Risk analysis.PNG (file) |  |
55 KB | 3 | |
| 04:26, 20 September 2006 | Operators and or in probability.PNG (file) |  |
6 KB | 1 | |
| 04:27, 20 September 2006 | Defining probability with a decision tree.PNG (file) | 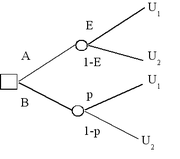 |
6 KB | 1 | |
| 14:09, 4 December 2006 | Pyrkilo template.ANA (file) | 1 KB | Template for pyrkilo diagrams in Analytica. | 1 | |
| 06:21, 6 December 2006 | Biofuel overview.JPG (file) | 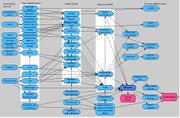 |
149 KB | Overview of biofuels and their effects on climate change and health | 1 |
| 06:22, 6 December 2006 | Biofuel arguments.JPG (file) | 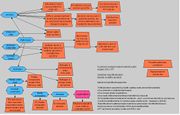 |
139 KB | Arguments about biofuels and their usage. | 1 |
| 06:23, 6 December 2006 | Biofuels in Finland.ANA (file) | 23 KB | Analytica file of biofuels in Finland | 1 | |
| 10:37, 12 January 2007 | IMG 0003.jpg (file) |  |
72 KB | 1 | |
| 10:39, 12 January 2007 | ORA platform.jpg (file) |  |
72 KB | 2 | |
| 21:18, 7 February 2007 | Pyrkilo intro presentation.ppt (file) | 207 KB | This is an introductory presentation to the pyrkilo method. | 1 | |
| 20:06, 10 March 2007 | Heande logo.JPG (file) |  |
6 KB | First draft of a new logo for Heande. It contains a heart (health, and value judgements), a tree (the environment), and a magnifying glass (scientific method). | 1 |
| 06:18, 13 June 2007 | Public health determinants.PNG (file) | 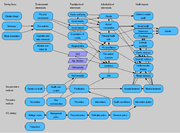 |
38 KB | Influence diagram about major public health determinants. | 1 |
| 20:42, 12 October 2007 | Gasbus model.ANA (file) | 45 KB | New version of the model: the graphical formatting updated according to the new notation (calculation not changed). | 2 | |
| 14:38, 16 October 2007 | Public health determinants.ANA (file) | 40 KB | comments based on the meeting today | 4 | |
| 06:44, 17 October 2007 | Landuse in peatlands.PNG (file) | 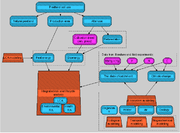 |
24 KB | 1 | |
| 07:48, 27 December 2007 | Farmed salmon assessment.PNG (file) |  |
27 KB | Diagram of the Variable:Assessment:Farmed salmon created by Jouni Tuomisto et al. Science 2004. | 1 |
| 09:13, 27 December 2007 | Benefit-risk diagram for farmed salmon.PNG (file) | 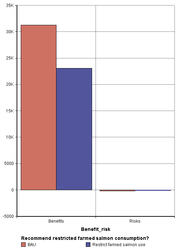 |
14 KB | Benefits and risks of farmed salmon. The figure relates to the assessment Assessment:Farmed salmon. | 1 |
| 09:29, 27 December 2007 | VOI analysis for farmed salmon.PNG (file) | 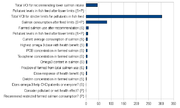 |
23 KB | see Variable:Assessment:Farmed salmon | 1 |
| 23:20, 2 January 2008 | Full chain approach.PNG (file) | 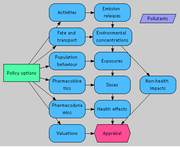 |
13 KB | Pollutants added | 3 |
| 14:03, 3 January 2008 | Epitox.PNG (file) | 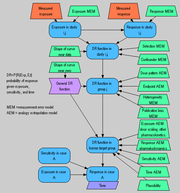 |
23 KB | Copied from Intarese wiki. | 1 |
| 08:45, 17 January 2008 | General process description.svg (file) | 11 KB | Saved as svg, not Inkscape-svg as the previous version. | 2 | |
| 14:26, 30 January 2008 | Variable transfer protocol.PNG (file) | 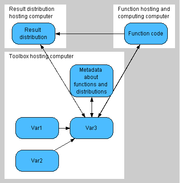 |
10 KB | Basic elements of a variable transfer protocol (VTP). | 1 |
| 06:53, 19 February 2008 | ORA workshop lecture4 2008.ppt (file) | 1.17 MB | typos corrected | 4 | |
| 11:52, 19 February 2008 | Assessment on health impacts of bus emissions in Helsinki.PNG (file) | 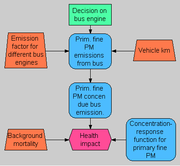 |
10 KB | The graph is a caulal diagram for the assessment on health impacts of fine particle emissions from the bus fleet in the Helsinki Metropolitan Area. | 1 |
| 08:42, 20 February 2008 | ORA workshop lecture6 2008.ppt (file) | 124 KB | final | 3 | |
| 20:07, 9 March 2008 | Gasbus model 01.ANA (file) | 101 KB | Result database connection module added. In addition, some index names changed so that they are explicit in a wider context. | 2 | |
| 13:35, 25 March 2008 | Transferring to result database.ANA (file) | 16 KB | Added a function to transform Analytica results to (wiki) tables with statistics | 2 | |
| 11:45, 8 April 2008 | ORA workshop lecture1.ppt (file) | 1.8 MB | The version prepared for the risk assessment course in CII, Nicosia, Cyprus, 7.-11.4.2008. | 6 | |
| 19:28, 27 April 2008 | Impact calculation tool.ANA (file) | 3 KB | Tool for calculating DALYs. This is based on a WHO Excel file [http://www.who.int/entity/healthinfo/bodreferencedalycalculationtemplate.xls]. | 1 | |
| 13:39, 29 April 2008 | Dose-response estimator.ANA (file) | 14 KB | A model that calculates dose-response functions (one-hit model and Weibull) for quantal data. It is based on hand-driven exploration of the likelihood function to find optimal parameter numbers. Developed by Jouni Tuomisto with the help from John Evans. | 1 | |
| 06:51, 14 June 2008 | Abstraction levels.ANA (file) | 3 KB | Graph resturctured | 2 | |
| 07:07, 14 June 2008 | Abstraction levels.PNG (file) |  |
12 KB | minor change | 4 |
| 12:15, 19 June 2008 | Assessment on Institute of Public Health and Welfare.PNG (file) | 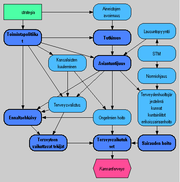 |
15 KB | A graph about the operational environment of a governmental Institute of Public Health and Welfare. | 1 |
| 13:16, 3 September 2008 | Result Database Demo.ppt (file) | 1.13 MB | An intro page added. | 3 | |
| 09:57, 8 September 2008 | VOI analysis.ANA (file) | 13 KB | The previous version was from image:Farmed salmon.ANA model (from 2004). This version is dated 11.7.2005. | 2 | |
| 07:18, 10 September 2008 | Variable correlator.ANA (file) | 14 KB | Version 11 Jul 2005. Original location [http://ytoswww/yhteiset/Huippuyksikko/Tutkimus/R20_Mallit/Functions/Correl_1.ANA]. | 2 | |
| 13:36, 10 September 2008 | Finnish population.ANA (file) | 409 KB | Analytica file about Finnish population statistics. | 1 | |
| 12:21, 18 September 2008 | CarbonTrade city-level.PNG (file) |  |
67 KB | A new version with all (?) submodels shown. | 2 |
| 12:41, 19 September 2008 | Help for enhanced causal diagrams.PNG (file) | 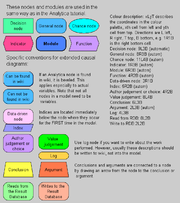 |
31 KB | A picture of the updated version of image:Help for enhanced causal diagrams.ANA. | 1 |
| 12:53, 19 September 2008 | Help for enhanced causal diagrams.ANA (file) | 9 KB | Updated based on the current conventions. | 5 | |
| 09:48, 9 October 2008 | RDB connection.ANA (file) | 55 KB | Added new functionality for describing locations. This is already reflected in the structure of the RDB. There is a development need in New_locs. | 13 | |
| 11:24, 9 October 2008 | RDB reader.ANA (file) | 14 KB | Description field added. A function Descr added: it brings the descriptions of the locations of an index. | 8 | |
| 20:54, 9 October 2008 | Expolis.ANA (file) | 651 KB | Model contains Expolis data as it is in the Concentration database, today's version. Original file N:\ILMA\_Projects\iF\Database\condb\Expolis_data.xls. Questionnaire data is not included (yet). | 1 |