Photovoltaic Geographic Information System
Photovolataic Geographic Information System (PVGIS) database is a research, demonstration and policy-support instrument for geographical assessment of the solar energy resource in the context of integrated management of distributed energy generation.
For Europe, the database contains three groups of grid (raster) layers with resolution of 1 km x 1 km:
- geographical data: digital elevation model, administrative boundaries, CORINE land cover and Global land cover, cities, etc.
- spatially continuous climatic data series representing monthly and annual means of:
- daily sum of global irradiation for horizontal plane. This value is the monthly/yearly average of the sum of the solar radiation energy that hits one square meter in a horizontal plane in one day. This is measured in Wh/m2/day.
- Linke atmospheric turbidity. This is a measure of how much the solar radiation is attenuated by aerosols. It indicates the optical density of hazy and humid atmosphere in relation to a clean and dry atmosphere. It is dimensionless.
- ratio of diffuse to global irradiation
- regional averages for built-up areas:
- yearly total of global irradiation (horizontal, vertical and optimally- inclined planes) [kWh]
- yearly total of estimated solar electricity generation (for horizontal, vertical, optimally-inclined planes) [kWh]
- optimum inclination angle of the PV modules to maximize energy yield over a year (degrees]

Additional data, such as average daytime temperatures (average of the temperature between sunrise and sunset for each month at the location you choose), and average daily temperatures (average of the temperature during the entire 24 hours of a day for each month at the location you choose), are also available.
Data sources from whic h the data were derived include:
- monthly averages of daily sums of global and diffuse irradiation, measured or calculated for 566 ground meteorological stations distributed over the region. The averages represent the period 1981-1990; the data were collected within the ESRA project.
- Linke turbidity derived from the global database (Remund et al. 2003), available also at the SoDa.
- digital elevation model with a grid resolution 1x1 km; derived from the USGS SRTM data
- CORINE land cover with grid resolution 100x100 metres
- Global Land Cover 2000 with grid resolution 1x1 km
- GISCO database (© EuroGeographics Association for the administrative boundaries)
- VMAP0 and ESRI data
Data are available in three different ways:
- as a table of monthly and yearly averages for each type of data.
- as a graph of monthly values.
- as a colour-coded map of the region you are looking at.
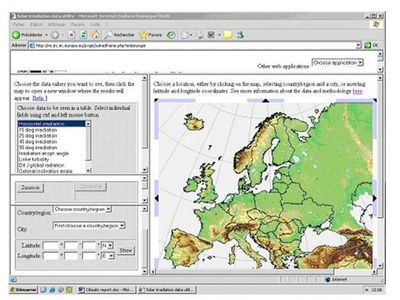
The interface (see figure) allows users to browse by type of data, city and geographical coordinates or to use the map graphical interface.