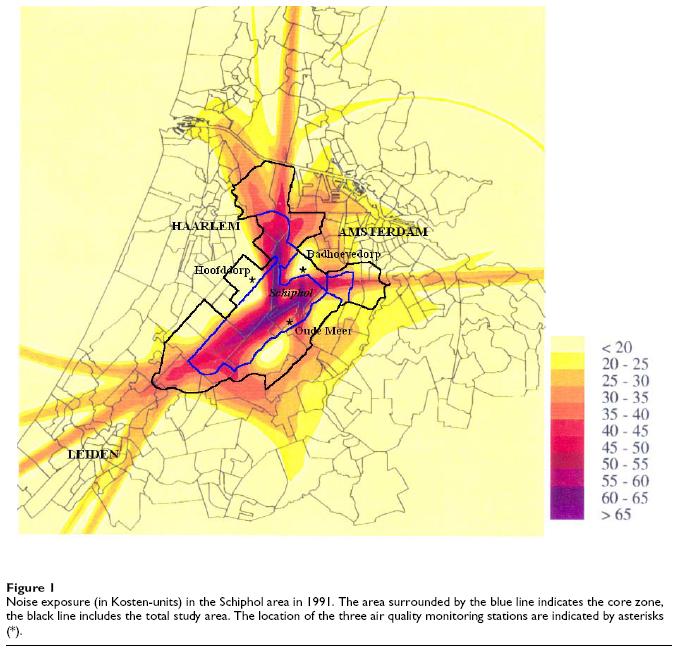
Noise exposure around the Schiphol airport
If you need help about filling in a variable open the link at the end of this paragraph in a new window. Otherwise, just delete this paragraph and start writing.
Scope
Noise exposure gives the number of people exposed to different levels of noise in the vicinity of Schiphol airport
Description
In Lu & Morrell (2006) the level of noise is measured in Kosten unit (KU). 10 KU was used as the background level. Number of residences within the noise contour 20-10 KU is missing from their data (unavailable).
KU cannot be converted to noise exposure in dB(A) [1]
Visser et al (2005) published a noise map (although this is probably not the original place of publication).
References
- Schiphol Group (2002). Gebruiksplan Schiphol 2001. The Netherlands. In:Lu, C. & Morrell, P. (2006). Determination and applications of environmental costs at different sized airports - aircraft noise and engine emissions
- Otto Visser, Joop H van Wijnen and Flora E van Leeuwen: Incidence of cancer in the area around Amsterdam Airport Schiphol in 1988–2003: a population-based ecological study. BMC Public Health 2005, 5:127 doi:10.1186/1471-2458-5-127
Definition
Causality
List of parents:
Data
Schiphol Group (2002):
Kosten unit (KU): number of residences
- >65: 14
- 60-65: 33
- 55-60: 70
- 50-55: 402
- 45-50: 1675
- 35-40: 3358
- 35-40: 3857
- 30-35: 13539
- 25-30: 44048
- 20-25: 55634
Formula
Analytica_id:
<anacode></anacode>
