Risk assessment of nitrate in drinking water: Difference between revisions
mNo edit summary |
mNo edit summary |
||
| Line 24: | Line 24: | ||
=== Boundaries === | === Boundaries === | ||
'''European countries in selected regions:''' | |||
* First pass assessment: | |||
**England and Wales | |||
* Second pass assessment: | |||
** England and Wales | |||
** Finland | ** Finland | ||
** Spain | ** Spain | ||
** Romania | ** Romania | ||
**Hungary | **Hungary | ||
* Infants < 6 months of age | * Infants < 6 months of age | ||
* Exposure to nitrate via baby food formula mixed with drinking water and via drinking water | * Exposure to nitrate via baby food formula mixed with drinking water and via drinking water (onlt tap water in the first pass asessment) | ||
* Effects: infant methemoglobinemia (iMetHb). More detailed information about methemoglobinemia and other nitrate related health effects is found in [http://www.pyrkilo.fi/intarese/index.php/WP3.4_Selection_of_health_outcome_for_nitrates| INTAESE wiki]. | * Effects: infant methemoglobinemia (iMetHb). More detailed information about methemoglobinemia and other nitrate related health effects is found in [http://www.pyrkilo.fi/intarese/index.php/WP3.4_Selection_of_health_outcome_for_nitrates| INTAESE wiki]. | ||
| Line 40: | Line 46: | ||
* Drinking water source: Tap water or well water | * Drinking water source: Tap water or well water | ||
* Increased use of bottled water | * Increased use of bottled water | ||
For the first pass it was deemed appropriate to carry out a diagnostic assessment i.e. to estimate the scale of the health impacts under present conditions, which in this case make use of 2003 as the baseline year. It was recognised that the causal diagram should be constructed in such a way that the introduction of policy scenarios is possible, since this is intended for the second pass of the assessment. The introduction of such potential policy scenarios would allow the diagnostic assessment to be transformed into a prognostic assessment i.e. a causal diagram which allows the estimation the likely consequences of different policy options, primarly as a basis for choosing between them. <ref name="briggs">Briggs DJ. Integrated assessment for policies on environmental health. Draft. Unpublished document. 2008. | For the first pass it was deemed appropriate to carry out a diagnostic assessment i.e. to estimate the scale of the health impacts under present conditions, which in this case make use of 2003 as the baseline year. We also looked at only areas in England and Wales. It was recognised that the causal diagram should be constructed in such a way that the introduction of policy scenarios is possible, since this is intended for the second pass of the assessment. The introduction of such potential policy scenarios would allow the diagnostic assessment to be transformed into a prognostic assessment i.e. a causal diagram which allows the estimation the likely consequences of different policy options, primarly as a basis for choosing between them. <ref name="briggs">Briggs DJ. Integrated assessment for policies on environmental health. Draft. Unpublished document. 2008. | ||
</ref> | </ref> | ||
| Line 84: | Line 89: | ||
=== Indices === | === Indices === | ||
* [http://www.pyrkilo.fi/intarese/index.php/Index:Area| England and Wales | * [http://www.pyrkilo.fi/intarese/index.php/Index:Area| Areas in England and Wales] | ||
* Finland areas | * Finland areas | ||
* Country | * Country | ||
Revision as of 07:12, 4 September 2008
This is the main page of the WP3.4 assessment of the health impacts of nitrate in drinking water. This and the articles linked to it describe the first pass assessment.
The article of the reporting associated with this assessment (i.e. the deliverable) is located here. The assessment itself is located on INTARESE Mediawiki.
Background material:
- There is considerable general material available on this wiki on the development of the WP3.4 assessment
- The article on the WP3.4 First pass assessment provides an overview of all the assessments grouped under WP3.4
- The models described on this page are Analytica files. While the software is proprietary (i.e. not free), a free viewer (Analytica player) is available in which models can be investigated, and a free trial version is available at the Lumina Decision Systems website.
This is the main page of nitrate risk assessment conducted in INTARESE WP3.4. The analytica file can be uploaded here: File:Nitrate.ANA. Detailed information about nitrates in drinking water is found in INTARESE wiki.
Scope
Purpose
To investigate the effects of nitrate contaminated drinking water.
Boundaries
European countries in selected regions:
- First pass assessment:
- England and Wales
- Second pass assessment:
- England and Wales
- Finland
- Spain
- Romania
- Hungary
- Infants < 6 months of age
- Exposure to nitrate via baby food formula mixed with drinking water and via drinking water (onlt tap water in the first pass asessment)
- Effects: infant methemoglobinemia (iMetHb). More detailed information about methemoglobinemia and other nitrate related health effects is found in INTAESE wiki.
Scenarios
This assessment focused only on the current situation, therefore scenarios are not included in the assessment. In the future the assessment may contain the following scenarios:
- Drinking water source: Tap water or well water
- Increased use of bottled water
For the first pass it was deemed appropriate to carry out a diagnostic assessment i.e. to estimate the scale of the health impacts under present conditions, which in this case make use of 2003 as the baseline year. We also looked at only areas in England and Wales. It was recognised that the causal diagram should be constructed in such a way that the introduction of policy scenarios is possible, since this is intended for the second pass of the assessment. The introduction of such potential policy scenarios would allow the diagnostic assessment to be transformed into a prognostic assessment i.e. a causal diagram which allows the estimation the likely consequences of different policy options, primarly as a basis for choosing between them. [1]
Intended users
Participants
- Researchers at KTL
- Researcher at Imperial College London
- Researchers at London School of Hygiene & Tropical Medicine
- Researchers at Municipal Institute of Medical Research Foundation
Definition
Causal diagram
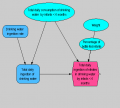
Detailed documentation of the design, elaboration and construction of the causal diagram to be used in this assessment is given in article found in |INTARESE wiki. The final draft is presented in figure 1. The working Analytica version of the nitrate model File:Nitrate.ANA.
-
Figure 1 - Causal diagram for assessment of the impacts of exposure to nitrate due to MetHg
-
Figure 2 - Analytica model of nitrate risk assessment
Decision variables
- Drinking water source (population using public/private water supplies)
Indicators
- Health risk estimates for iMetHb
- Excess cases of iMetHb
- Total ingestion of nitrates from drinking water by infacts < 6 months
Other variables
- Nitrate concentration in drinking water
- Exposure of infants < 6 months to water from private supply
- Infection status of infants < 6 months
- Exposure response function for nitrate and iMetHb: Detailed discussion of this can be found in INTARESE wiki
Indices
- Areas in England and Wales
- Finland areas
- Country
- Water source
Modules
-
Figure 3 - Sources
-
Figure 4 - Exposure
-
Figure 5 Dose response
-
Figure 6 - Health effects
Analyses
Result
Results
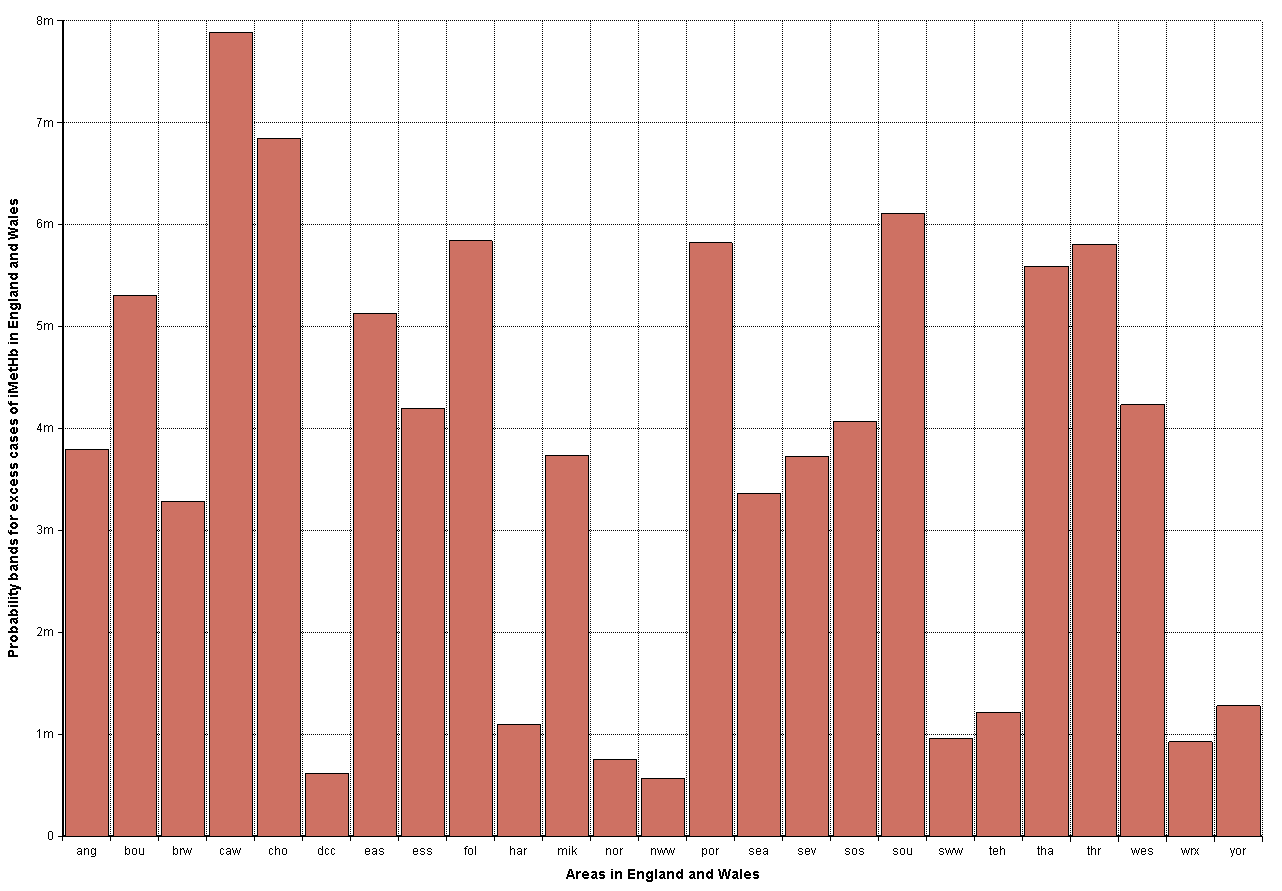
Excess cased of iMetHb
| Min | Median | Mean | Max | Std. Dev. | |
| ang | 4.379261194793641e-006 | 3.847597201790526e-003 | 0.1764231179486598 | 622.3192315450723 | 8.647306366248591 |
| bou | 6.152150102290086e-006 | 5.375449657922692e-003 | 10.58646550163398 | 8.001200831378713e+004 | 830.6531323622047 |
| brw | 4.454647443738536e-006 | 3.290376487938253e-003 | 15.96246947527328 | 1.43984447085521e+005 | 1447.60608736766 |
| caw | 9.223044405283126e-006 | 7.987090012198807e-003 | 2309.805085339419 | 1.590299303434219e+007 | 1.732889028794849e+005 |
| cho | 8.16484679314486e-006 | 7.028345604564555e-003 | 185.811018331088 | 1.231930046257489e+006 | 1.352256438298756e+004 |
| dcc | 7.437855220554363e-007 | 5.991015492996586e-004 | 4.093112726278305e-003 | 4.749570763833332 | 0.05137144317694659 |
| eas | 8.757724991737398e-006 | 5.253195524232276e-003 | 34.262957420025 | 3.372187884835449e+005 | 3372.338453142389 |
| ess | 2.424515101559594e-006 | 4.13259760816668e-003 | 34.95915683711863 | 3.487125704249137e+005 | 3487.125897868396 |
| fol | 3.827481811899054e-006 | 5.686946506511489e-003 | 16.09634524394721 | 1.331078524469925e+005 | 1346.554408865596 |
| har | 1.295013707239071e-006 | 1.094733113858843e-003 | 5.106845141056453e-003 | 2.286420750105928 | 0.03899765649225059 |
| mik | 3.352702041664116e-006 | 3.87378815650508e-003 | 4.447629272535715 | 2.776058946771572e+004 | 322.0660144885644 |
| nor | 1.000981411033315e-008 | 7.996248918385011e-004 | 3.850309512607605e+063 | 3.850309512607605e+067 | 3.85030951260784e+065 |
| nww | 3.529523520295868e-007 | 5.691896004402131e-004 | 0.02012505819598403 | 136.6633141665643 | 1.37466773904038 |
| por | 6.948358646294438e-006 | 5.88996477104971e-003 | 121.0394346889222 | 1.182788799881443e+006 | 1.183041515575052e+004 |
| sea | 4.079339785557403e-006 | 3.419956270015863e-003 | 0.07404738549259982 | 331.1540425232029 | 3.66465548236026 |
| sev | 4.520115219800164e-006 | 3.834105849700955e-003 | 0.2065733917632781 | 899.2365638797742 | 11.5962438813709 |
| sos | 8.303983924823974e-006 | 3.915383586033052e-003 | 0.387879773169181 | 1538.851521908299 | 20.74422836534712 |
| sou | 5.712656738275876e-006 | 6.159371603180619e-003 | 2753.679194641601 | 2.376834654619418e+007 | 2.406418299440552e+005 |
| sww | 2.576167682546308e-007 | 9.632059292909766e-004 | 0.01843743720315559 | 61.76370891994082 | 0.7696895034015112 |
| teh | 1.461990902476878e-006 | 1.255512180125084e-003 | 5.929486183770713e-003 | 3.288077446520652 | 0.05208145655204863 |
| tha | 8.941801397064362e-006 | 5.694444241558322e-003 | 722.1811466172278 | 7.187675052376742e+006 | 7.18771020093066e+004 |
| thr | 7.387519993576114e-006 | 5.732671894716331e-003 | 198.4471013694464 | 1.195747040827789e+006 | 1.398807148019777e+004 |
| wes | 3.187856388326675e-006 | 4.302891905164752e-003 | 1.959645359658838e+005 | 1.959642675711517e+009 | 1.959642675443615e+007 |
| wrx | 1.068489917316954e-006 | 9.629857512072751e-004 | 5.52291745044664e-003 | 3.95824288377023 | 0.05322298374036467 |
| yor | 7.524957916560245e-007 | 1.26432062450843e-003 | 0.01973950042174603 | 36.33773333522452 | 0.5349377754431618 |
Conclusions
References
- ↑ Briggs DJ. Integrated assessment for policies on environmental health. Draft. Unpublished document. 2008.


