IEHIAS models: example from agriculture: Difference between revisions
(Created page with "Category:IEHIAS Category:IEHIAS Scoping :''The text on this page is taken from an equivalent page of the IEHIAS-project. ''As part of the EU-funded IN...") |
No edit summary |
||
| Line 10: | Line 10: | ||
While the resulting mind-map provided an indication of the scope of the assessment, it was not the end of the story. As part of the process of assessment design, it had to be further revised and more tightly specified to give a firm basis for assessment as reflected in the final causal diagram. | While the resulting mind-map provided an indication of the scope of the assessment, it was not the end of the story. As part of the process of assessment design, it had to be further revised and more tightly specified to give a firm basis for assessment as reflected in the final causal diagram. | ||
==A mind-map== | |||
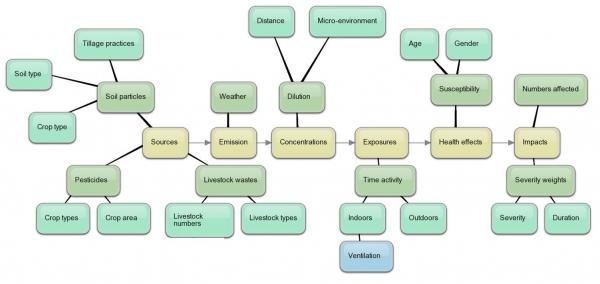
Mind-mapping was used to help explore the possible scope of the issues related to agriculture. Mind-mapping started by defining the key links in the causal chain (sources-impacts). Elements were then added outward by trying to define first the most immediate (proximal) factors influencing each of these links, and then progressively expanding outwards to more distal factors. | |||
The diagram below, showing a partial mind-map of the health effects of land use change, was made with the online Bubbl-us software. | |||
[[Image:iehiasmodelmindmap.jpg]] | |||
==A systems diagram== | |||
[[Image:iehiasmodelsystemsdiagram.png]] | |||
==Customising a causal chain== | |||
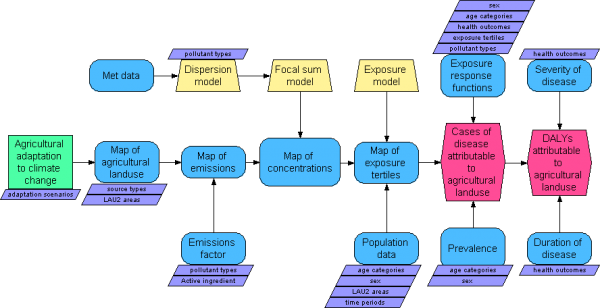
In the process, a conceptual model was built to define the system under consideration, and to highlight the elements that needed to be assessed. From an initially simple, highly structured representation of the causal chain, this gradually evolved into a more 'analytical' form, identifying the data and models that would be needed at each stage in the assessment. | |||
The following causal diagram was created in Analytica. (Please note, this is not available as a working analytica model.) It should be compared with the more intuitive conceptual models developed using mind-mapping and system diagram methods (see links below). | |||
[[Image:customisingacausalchain.png]] | |||
Revision as of 09:53, 7 August 2014
- The text on this page is taken from an equivalent page of the IEHIAS-project.
As part of the EU-funded INTARESE project, which contributed to the development of this Toolbox, a case study was done to assess the health impacts of agricultural land use change in Greece and England.
This assessment comprised a prognostic analysis of the potential health effects of changes in agricultural land use. The first step involved scoping the problem in a clear and concise way. This was done through a series of consultations between the scientists involved, and with representatives from several stakeholder groups and data providers.
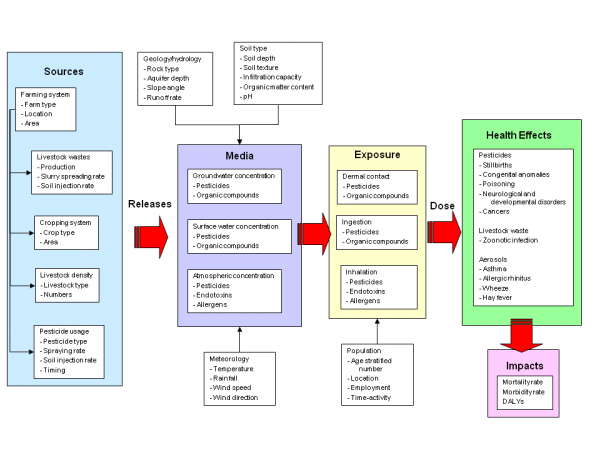
Initial scoping was done using mind-mapping methods. The resulting model was then refined and revised, to provide a more structured view of the problem, in the form of a systems diagram. In the process, reviews were carried out of the relevant scientific studies, to help identify which potential risk factors might be most important in affecting human health. As a consequence, three key risk factors emerged: pesticides, endotoxins and aerosols. Others that were initially considered for inclusion (e.g. health effects of nitrates) were omitted because of lack of sufficient evidence for significant health effects. In the same way, possible health outcomes of interest were defined. These focused mainly on respiratory effects (from all three agents) and cancers (from pesticide exposures).
While the resulting mind-map provided an indication of the scope of the assessment, it was not the end of the story. As part of the process of assessment design, it had to be further revised and more tightly specified to give a firm basis for assessment as reflected in the final causal diagram.
A mind-map
Mind-mapping was used to help explore the possible scope of the issues related to agriculture. Mind-mapping started by defining the key links in the causal chain (sources-impacts). Elements were then added outward by trying to define first the most immediate (proximal) factors influencing each of these links, and then progressively expanding outwards to more distal factors.
The diagram below, showing a partial mind-map of the health effects of land use change, was made with the online Bubbl-us software.
A systems diagram
Customising a causal chain
In the process, a conceptual model was built to define the system under consideration, and to highlight the elements that needed to be assessed. From an initially simple, highly structured representation of the causal chain, this gradually evolved into a more 'analytical' form, identifying the data and models that would be needed at each stage in the assessment.
The following causal diagram was created in Analytica. (Please note, this is not available as a working analytica model.) It should be compared with the more intuitive conceptual models developed using mind-mapping and system diagram methods (see links below).


