Additional results of EBoDE by country: Difference between revisions
Jump to navigation
Jump to search
(Created page with "{{Study|Moderator=Tiinu}} Category:EBoDE Belgium [[File:pictureofhenon-discountedenvironmentalburdenofdiseaseinbelgium.png|thumb|400px|picture of the non-discounted environ...") |
No edit summary |
||
| Line 7: | Line 7: | ||
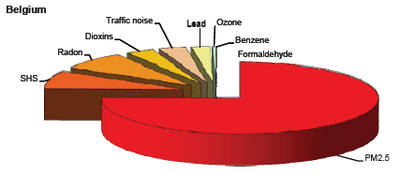
Relative contribution of the nine targeted stressors on the non-discounted environmental burden of disease in Belgium. | Relative contribution of the nine targeted stressors on the non-discounted environmental burden of disease in Belgium. | ||
{| {{prettytable}} | |||
|+ Results aggregated per stressor in Belgium | |||
|rowspan="2"| | |||
!colspan="2"|Total DALY's | |||
!colspan="2"|DALY's per million | |||
|- | |||
|non-discounted | |||
|discounted with lag | |||
|non-discounted | |||
|discounted with lag | |||
|- | |||
|PM<sub>2.5</sub> | |||
|106 988 | |||
|47 024 | |||
|10 462 | |||
|4 598.3 | |||
|- | |||
|SHS | |||
|11 349 | |||
|5 289 | |||
|1 110 | |||
|517.2 | |||
|- | |||
|Radon | |||
|11 028 | |||
|2 294 | |||
|1 078 | |||
|224.3 | |||
|- | |||
|Dioxins | |||
|4 628 | |||
|1 745 | |||
|453 | |||
|170.7 | |||
|- | |||
|Traffic noise | |||
|4 467 | |||
|3 292 | |||
|437 | |||
|321.9 | |||
|- | |||
|Lead | |||
|3 044 | |||
|927 | |||
|298 | |||
|90.6 | |||
|- | |||
|Ozone | |||
|530 | |||
|523 | |||
|52 | |||
|51.2 | |||
|- | |||
|Benzene | |||
|25 | |||
|12 | |||
|2.5 | |||
|1.1 | |||
|- | |||
|Formaldehyde | |||
|2 | |||
|1 | |||
|0.2 | |||
|0.1 | |||
|- | |||
|Total | |||
|142 062 | |||
|61 107 | |||
|13 892 | |||
|5 975 | |||
|- | |||
Revision as of 12:16, 7 June 2011
This page is a study.
The page identifier is Op_en5228 |
|---|
| Moderator:Nobody (see all) Click here to sign up. |
|
|
| Upload data
|
Belgium

Relative contribution of the nine targeted stressors on the non-discounted environmental burden of disease in Belgium.
| Total DALY's | DALY's per million | |||
|---|---|---|---|---|
| non-discounted | discounted with lag | non-discounted | discounted with lag | |
| PM2.5 | 106 988 | 47 024 | 10 462 | 4 598.3 |
| SHS | 11 349 | 5 289 | 1 110 | 517.2 |
| Radon | 11 028 | 2 294 | 1 078 | 224.3 |
| Dioxins | 4 628 | 1 745 | 453 | 170.7 |
| Traffic noise | 4 467 | 3 292 | 437 | 321.9 |
| Lead | 3 044 | 927 | 298 | 90.6 |
| Ozone | 530 | 523 | 52 | 51.2 |
| Benzene | 25 | 12 | 2.5 | 1.1 |
| Formaldehyde | 2 | 1 | 0.2 | 0.1 |
| Total | 142 062 | 61 107 | 13 892 | 5 975 |