Energy use of buildings: Difference between revisions
(updates for the report format) |
(OpasnetUtils::combine) |
||
| Line 203: | Line 203: | ||
other@output$Heating <- "Not heating" | other@output$Heating <- "Not heating" | ||
out <- combine(combine(heat, cool), other) | out <- OpasnetUtils::combine(OpasnetUtils::combine(heat, cool), other) | ||
out <- unkeep(out, prevresults = TRUE, sources = TRUE) | out <- unkeep(out, prevresults = TRUE, sources = TRUE) | ||
out@output <- fillna(out@output, marginals = "Temperature") | out@output <- fillna(out@output, marginals = "Temperature") | ||
| Line 276: | Line 276: | ||
#other@output$Heating <- "Not heating" | #other@output$Heating <- "Not heating" | ||
out <- combine(heat, cool, other) | out <- OpasnetUtils::combine(heat, cool, other) | ||
out <- unkeep(out, prevresults = TRUE, sources = TRUE) | out <- unkeep(out, prevresults = TRUE, sources = TRUE) | ||
out@output <- fillna(out@output, marginals = "Temperature") | out@output <- fillna(out@output, marginals = "Temperature") | ||
Latest revision as of 03:46, 10 April 2019
| Moderator:Marjo (see all) |
|
|
| Upload data
|
Question
How to model the use of energy of buildings based on either annual consumption per floor area, or energy efficiency per floor area per indoor-outdoor temperature difference?
Answer

An example code for fetching and using the variables.
Rationale
Input
| Dependencies | Measure | Indices | Missing data |
|---|---|---|---|
| buildings (from the model). | Floor area of the building stock to be heated | Typical indices: Building, Heating, Efficiency, Renovation | You can use value 1 to calculate energy need per 1 m2 floor area. |
| temperene (fairly generic data for a given cultural and climatic area, e.g. from Energy use of buildings) | Energy need per floor area and indoor-outdoor temperature difference (W /m2 /K) | Required indices: Consumable, Fuel (Commodity). Typical indices: Building, Heating. | if this data is missing, you can only calculate building stock but nothing further. |
| nontemperene (fairly generic data for a given cultural and climatic area, e.g. from Energy use of buildings) | Energy need for hot water and other non-temperature-dependent activities | Required indices: Consumable, Fuel (Commodity). | Use 0 to calculate energy demand excluding non-heating energy use. |
| temperatures (location-specific data) | Average outdoor temperatures for particular temperature bins. | Reuired indices: Temperature. | If missing, use the annual energy version. |
| temperdays (location-specific data) | Number of days per year for particular temperature bins. | Required indices: Temperature. | If missing, use the annual energy version. |
| efficiencyRatio (fairly generic data for a cultural and climatic area, e.g. from Energy use of buildings) | Relative energy consumption compared with the efficiency group Old. | Required indices: Efficiency. Typical indices: Time, Building. | If no data, use 1 as default. |
| renovationRatio (fairly generic data for a cultural and climatic area, e.g. from Energy use of buildings) | Relative energy consumption compared with the Renovation location None. | Required indices: Renovation. Typical indices: Building. | If no data, use 1 as default. |
Annual calculations
The code below assumes annual energy consumption factors per floor area (kWh /m2 /a). No temperature data is needed.
Failed to parse (SVG (MathML can be enabled via browser plugin): Invalid response ("Math extension cannot connect to Restbase.") from server "https://wikimedia.org/api/rest_v1/":): {\displaystyle Q_{e,r} = \sum_b B_{b,e,r} F_b E_e R_r,}
where
- Q = Energy used for heating and cooling (kWh /a)
- B = floor area of a building stock indexed by renovation and efficiency (m2)
- F = energy consumption factor (kWh / m2 /a)
- E = relative efficiency of a building stock based on energy class when built (no unit)
- R = relative efficiency of a building stock based on energy class after renovated (no unit)
- indices used:
- b = building type
- e = efficiency class of building
- r = renovation class of building
Temperature-dependent calculations
The code below assumes energy consumption factors relative to floor area (W /m2 /K). Local temperature data must be given in either individual or aggregated way. Individual way has temperature data for all timepoints (e.g. days or hours) of the given year, and heatingTime = 1. Aggregated way has a specific Temperature index (e.g. very cold, cold, cool etc) in both ovariables temperature and heatingTime. The ovariable temperature tells what is the actual temperature when it is "very cold", and heatingTime tells how many hours it is "very cold" during the year.
Failed to parse (SVG (MathML can be enabled via browser plugin): Invalid response ("Math extension cannot connect to Restbase.") from server "https://wikimedia.org/api/rest_v1/":): {\displaystyle Q_{e,r,t} = \sum_b (B_{b,e,r} U_b (17 - T_t) E_e R_r + W_b) t_t,}
where
- Q = Energy used for heating and cooling (kWh /a)
- B = floor area of a building stock indexed by renovation and efficiency (m2)
- U = energy consumption factor per floor area for a building type (W /m2 /K)
- T = temperature outside (assumes that no heating is needed if outside temperature is 17 degrees Celsius)
- E = relative efficiency of a building stock based on energy class when built (no unit)
- R = relative efficiency of a building stock based on energy class after renovated (no unit)
- W = heating need of hot water (W)
- t = time spent in a particular outdoor temperature (h /a)
- indices used:
- b = building type
- e = efficiency class of building
- r = renovation class of building
- t = ambient temperature class
Baseline energy consumption
Heat reflects the energy need for heating in situations where the outdoor temperature is below 17 °C. Cooling reflects the cooling need (measured as thermal energy, not electricity!) in situations where the outdoor temperature is above 24 °C. This is not a U value, because it is about energy use per floor area, not about heat loss through building structures per m2. For estimating temperene, we take the total energy consumption in Helsinki and divide that with the total floor area and average temperature difference, see Helsinki energy consumption#U values based on overall data.
| Obs | Consumable | Fuel | Energy flow | Description |
|---|---|---|---|---|
| 1 | Heating | Heat | 1.66 | See Helsinki energy consumption: 6921.65/24/365/38990000/(17-4.8)*1E+9 |
| 2 | District cooling | Cooling | 0.3 | Guesswork. This uses centralised system. |
| 3 | Electric cooling | Electricity | 0.3 | Guesswork. This uses apartment-specific appliances. |
Temperature-independent energy consumption per floor area.
| Obs | Consumable | Fuel | Energy intensity | Description |
|---|---|---|---|---|
| 1 | Consumer electricity | Electricity | 5 | Assumes 50 kWh /m2 /a (see below) |
| 2 | Hot water | Heat | 4 | Assumes that hot water is ca. 20 % of energy need of heating: 6921.65/24/365/38990000*1E+9*0.2 |
| Obs | Building | Heating | Heat | User electricity | Total electricity | Year | Description |
|---|---|---|---|---|---|---|---|
| 1 | Detached houses | District | 134.74 | 50 | 184.74 | 2010 | Calculated from energy company´s data; Pöyry |
| 2 | Detached houses | Electricity | 130 | 50 | 180 | 2010 | Energiapolar; Pöyry |
| 3 | Detached houses | Oil | 134.74 | 50 | 50 | 2010 | Pöyry. Efficiency 90-95% (energiatehokaskoti.fi). |
| 4 | Detached houses | Wood | 134.74 | 50 | 50 | 2010 | Assumption. Efficiency of good kettles 80%(energiatehokaskoti.fi). |
| 5 | Detached houses | Geothermal | 40 | 50 | 90 | 2010 | Assumption |
| 6 | Row houses | 168.88 | 73.5 | 73.5 | 2010 | Calculated from energy company´s data. Based on district | |
| 7 | Apartment houses | 172.31 | 41.7 | 41.7 | 2010 | Calculated from energy company´s data. Based on district | |
| 8 | Commercial | 161.82 | 229.6 | 229.6 | 2010 | Calculated from energy company´s data. Based on district | |
| 9 | Offices | 161.07 | 93.1 | 93.1 | 2010 | Calculated from energy company´s data. Based on district | |
| 10 | Health and social sector | 214.97 | 122.81 | 122.81 | 2010 | Calculated from energy company´s data. Based on district | |
| 11 | Public | 165.47 | 110.4 | 110.4 | 2010 | Calculated from energy company´s data. Based on district | |
| 12 | Sports | 121.38 | 85.9 | 85.9 | 2010 | Calculated from energy company´s data. Based on district | |
| 13 | Educational | 170 | 116.4 | 116.4 | 2010 | Calculated from energy company´s data. Based on district | |
| 14 | Industrial | 168.44 | 212.4 | 212.4 | 2010 | Calculated from energy company´s data. Based on district | |
| 15 | Leisure houses | 2.4 | 1 | 3.4 | 2010 | Calculated from energy company´s data. Based on electricity | |
| 16 | Other | 138.14 | 170.3 | 170.3 | 2010 | Calculated from energy company´s data | |
| 17 | Non-residential buildings | No energy source | 113 | Urgenche data for Basel | |||
| 18 | Non-residential buildings | Heating oil | 113 | Urgenche data for Basel | |||
| 19 | Non-residential buildings | Coal | 113 | Urgenche data for Basel | |||
| 20 | Non-residential buildings | Gas | 113 | Urgenche data for Basel | |||
| 21 | Non-residential buildings | Electricity | 113 | Urgenche data for Basel | |||
| 22 | Non-residential buildings | Wood | 113 | Urgenche data for Basel | |||
| 23 | Non-residential buildings | Centrifuge, hydro-extractor | 113 | Urgenche data for Basel | |||
| 24 | Non-residential buildings | Solar heater/ collector | 113 | Urgenche data for Basel | |||
| 25 | Non-residential buildings | Long-distance heating | 113 | Urgenche data for Basel | |||
| 26 | Non-residential buildings | Other sources | 113 | Urgenche data for Basel | |||
| 27 | Special constructions | 86-106 | Urgenche data for Basel (Mixed use) | ||||
| 28 | Single-family houses | 69 | Urgenche data for Basel | ||||
| 29 | Multiple-family houses | 54-106 | Urgenche data for Basel | ||||
| 30 | Residential buildings with subsidiary use | 86-106 | Urgenche data for Basel | ||||
| 31 | Buildings with partial residential use | 86-106 | Urgenche data for Basel |
Energy efficiency in heating
What is the relative energy consumption of different efficiency classes compared with Old? This table tells that with some background information about heat (in kWh/m2/a), electricity, and water consumption.
| Obs | Efficiency | Ratio | Heat | User electricity | Water | Description |
|---|---|---|---|---|---|---|
| 1 | Traditional | 1.2-1.4 | 200 | Guesstimate | ||
| 2 | Old | 1 | 150 | 30 | Pöyry 2011 s.28 | |
| 3 | New | 0.4-0.5 | 70 | 50 | 40 | Pöyry 2011 s.32 (2010 SRMK) |
| 4 | Low-energy | 0.2-0.25 | 35 | 50 | 40 | Personal communication |
| 5 | Passive | 0.1-0.16 | 17.5 - 25 | 50 | 40 | Pöyry 2011 s.33; Personal communication |
| Obs | Efficiency | Constructed | Fraction | Description |
|---|---|---|---|---|
| 1 | Traditional | 1800-1944 | 100 | |
| 2 | Old | 1945-1994 | 100 | |
| 3 | New | 1995-2019 | 100 | |
| 4 | New | 2020-2029 | 10-20 | |
| 5 | Low-energy | 2020-2029 | The rest of energy class | |
| 6 | Passive | 2020-2029 | 25-35 | |
| 7 | New | 2030-2039 | 5-10 | |
| 8 | Low-energy | 2030-2039 | 20-50 | |
| 9 | Passive | 2030-2039 | The rest of energy class | |
| 10 | New | 2040-2070 | 0-5 | |
| 11 | Low-energy | 2040-2070 | 10-30 | |
| 12 | Passive | 2040-2070 | The rest of energy class |
- Old: old buildings to be renovated (or in need of renovation)
- New: normal new buildings (no current need of renovation)
- Low-energy: buildings consuming about half of the energy of a new building
- Passive: buildings consuming a quarter or less of the energy of a new building
- Chinese green building system: [3] [4]
Impact of renovations
| Obs | Renovation | Relative | Absolute | Renovation details | Description |
|---|---|---|---|---|---|
| 1 | Windows | 0.85 | 25 | New windows and doors | Pöyry 2011 |
| 2 | Technical systems | 0.50 | 75 | New windows, sealing of building's sheath, improvement of building's technical systems | Pöyry 2011 |
| 3 | Sheath reform | 0.35 | 100 | New windows, sealing of building's sheath, improvement of building's technical systems, significant reform of building's sheath | Pöyry 2011 |
| 4 | General | 0.85 | - | General renovation | Pöyry 2011 |
| 5 | None | 1 | 0 | Renovation not done |
Data not used
- This section contains data that are relevant for the topic but are not used in the actual method calculations.
----#: . Note that below numbers are very preliminary (esp. electricity)! --Marjo 16:49, 13 March 2013 (EET) (type: truth; paradigms: science: comment)
| Obs | Building | Heating | Heat | User electricity | Year | Description |
|---|---|---|---|---|---|---|
| 1 | Detached houses | District | 42.15 | 15.67 | 2010 | Calculated from energy company´s data; Energiapolar |
| 2 | Detached houses | Electricity | 40.66 | 15.67 | 2010 | Energiapolar |
| 3 | Detached houses | Oil | 42.15 | 15.67 | 2010 | Energiapolar |
| 4 | Detached houses | Wood | 42.15 | 15.67 | 2010 | Assumption |
| 5 | Detached houses | Geothermal | 18.56 | 15.67 | 2010 | Assumption |
| 6 | Row houses | District | 53.25 | 23.16 | 2010 | From energy company |
| 7 | Apartment houses | District | 49.2 | 11.9 | 2010 | From energy company |
| 8 | Commercial | District | 28.65 | 40.64 | 2010 | From energy company |
| 9 | Offices | District | 36.32 | 20.99 | 2010 | From energy company |
| 10 | Health and social sector | District | 55.2 | 31.53 | 2010 | From energy company |
| 11 | Public | District | 32.21 | 21.49 | 2010 | From energy company |
| 12 | Sports | District | 18.37 | 13 | 2010 | From energy company; Electricity value comes from city´s renovation data |
| 13 | Educational | District | 40.23 | 27.54 | 2010 | From energy company |
| 14 | Industrial | District | 30.57 | 38.55 | 2010 | From energy company |
| 15 | Leisure houses | Electricity | 0.68 | 0.29 | 2010 | From energy company |
| 16 | Other | District | 29.88 | 36.83 | 2010 | From energy company |
Regulations regarding energy consumption of buildings
| Obs | Building | Year | E-value | Description |
|---|---|---|---|---|
| 1 | Detached houses | 2012 forward | 204 | Heated net area <120 m2; Finland´s Environmental Administration |
| 2 | Row houses | 2012 forward | 150 | Finland´s Environmental Administration |
| 3 | Apartment houses | 2012 forward | 130 | Finland´s Environmental Administration |
| 4 | Shops and other commercial buildings | 2012 forward | 240 | Finland´s Environmental Administration |
| 5 | Offices | 2012 forward | 170 | Finland´s Environmental Administration |
| 6 | Health and social sector: Hospitals | 2012 forward | 450 | Finland´s Environmental Administration |
| 7 | Health and social sector: Health care centers etc. | 2012 forward | 170 | Finland´s Environmental Administration |
| 8 | Public | 2012 forward | 240 | Finland´s Environmental Administration |
| 9 | Sports | 2012 forward | 170 | Does not apply to swimming- and ice halls; Finland´s Environmental Administration |
| 10 | Educational | 2012 forward | 170 | Finland´s Environmental Administration |
| 11 | Industrial | 2012 forward | - | E-value must be calculated but there´s no limit for it; Finland´s Environmental Administration |
| 12 | Leisure buildings | 2012 forward | - | E-value must be calculated but there´s no limit for it; Finland´s Environmental Administration |
| 13 | Other | 2012 forward | - | E-value must be calculated but there´s no limit for it; Finland´s Environmental Administration |
See also
-
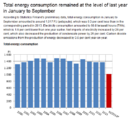
Energy consumption rate shows that people are using more energy than years before or it is about the same in Finland.
-
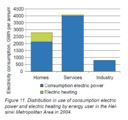
Most of the electricity is consumed in service sectors and homes. Moreover, the electricity produced by heating is used mostly in stakeholders and a little amount in service sector.
-
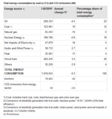
Wood fuels are the biggest source of energy in Finland.
- Juhani Heljo, Hannele Laine. Sähkölämmitys ja lämpöpumput sähkönkäyttäjinä ja päästöjen aiheuttajina Suomessa] TTY 2/2005. [5] ←--#: . Contains emission factors etc. May also be used in Emission factors for burning processes. --Jouni (talk) 07:38, 18 June 2015 (UTC) (type: truth; paradigms: science: defence)
- Juhani Heljo, Eero Nippala, Harri Nuuttila. Rakennusten energiankulutus ja CO2-ekv päästöt Suomessa. TTY 4/2005. [6]


