Variable structure: Difference between revisions
No edit summary |
(Redirected page to Variable) |
||
| (2 intermediate revisions by the same user not shown) | |||
| Line 1: | Line 1: | ||
#REDIRECT[[Variable]] | |||
[[Category:Open assessment]] | [[Category:Open assessment]] | ||
{{variable|moderator=Mikko Pohjola | {{variable|moderator=Mikko Pohjola | ||
Latest revision as of 09:48, 7 June 2012
Redirect to:
| Moderator:Mikko Pohjola (see all) |
|
|
| Upload data
|
Question
- What is a structure of a variable such that it
-
- is able to systematically handle all kinds of information about the particular piece of reality that the variable is describing,
- is able to systematically describe causal relationships between variables,
- enables both quantitative and qualitative descriptions,
- is suitable for any kinds of variables, especially physical phenomena, decisions, and value judgements,
- inherits its main structure from universal objects,
- complies with the PSSP ontology,
- can be operationalised in a computational model system,
- results in variables that are independent of the assessment(s) it belongs to;
- results in variables that pass the clairvoyant test?
Answer
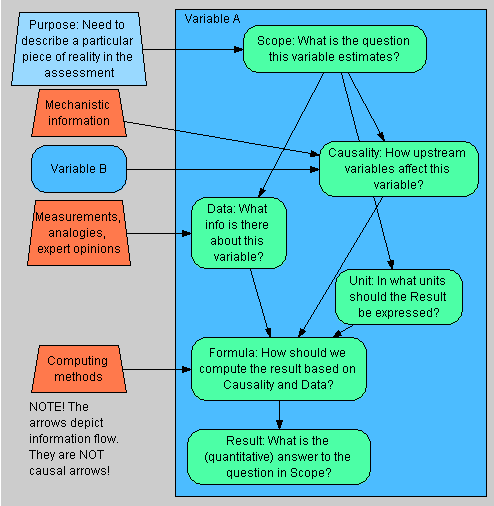
| Attribute | Sub-attribute | Comments specfic to the variable attributes |
|---|---|---|
| Name | ||
| Question | This includes a question from the viewpoint of the user, such that serves the users purposes. | |
| Answer | An answer presents an understandable answer to the question. It is preferably a probability distribution (which can in a special case be a single number), but an answer can also be non-numerical such as "very valuable". The units of interconnected variables need to be coherent with each other given the functions describing causal relations. The units of variables can be used to check the coherence of the causal network description. This is a so called unit test. | |
| Rationale | Rationale | Rationale gives credibility to the answer in the eyes of a critical reader. It presents the reader the information required to derive the answer and explains how it is formed. |
| Dependencies | Dependencies R↻ tells what we know about how upstream variables (i.e. causal parents) affect the variable. Dependencies list the causal parents and expresses their functional relationships (the variable as a function of its parents) or probabilistic relationships (conditional probability of the variable given its parents). | |
| Formula | Formula R↻ is an operationalisation of how to calculate or derive the result. Formula uses algebra, computer code, or other explicit methods if possible. |
In addition, it is practical to have additional subtitles on a variable page. These are not attributes, though.
- See also
- References
Specific issues related to variable attributes
In a general form, the formula can be described as
result = formula(causal parameters, data parameters, unit),
- where formula is a function (expressed as algebra or computer code for a specified software) for calculating the result using the causal parameters (information from causally upstream variables) and the data parameters (information from observed data) as input. The formula can be placed within <anacode></anacode> or <rcode><rcode>, if it is expressed as Analytica or R code, respectively.
It should be noted that the result is the distribution itself, although it can be expressed as some kind of description of the distribution, such as mean and standard deviation. The result should be described in such a detailed way that the full distribution can be reproduced from the information presented under this attribute. A technically straightforward way to do this is to provide a large random sample from the distribution.
The result may be a different number for different locations, such as geographical positions, population subgroups, or other determinants (e.g. years 2000, 2001). Then, the result is described as
R given x1,x2,...
where R is the result and x1 and x2 are defining the locations along an index (e.g. Year3). Index is a technical tool for dealing with the dimensionality of the variable. A dimension means a property along which locations are located (e.g. Time). In this case, x1 and x2 are indices along some dimensions, and particular values of x1 and x2 are locations. A variable can have zero, one, or more dimensions. Even if a dimension is continuous, it is usually operationalised in practice as a list of discrete locations. R↻
Rationale
Dependencies
See also
References
Will appear here automatically, if cited above using the <ref></ref> tags.
Additional references can also be listed here.
