Uploading to Opasnet Base: Difference between revisions
(instructions from file:Opasnet base connection.ANA moved here without editing (yet)) |
(Data uploaded using Opasnet Base Import) |
||
| (12 intermediate revisions by 3 users not shown) | |||
| Line 2: | Line 2: | ||
[[Category:Opasnet Base]] | [[Category:Opasnet Base]] | ||
{{method|moderator=Jouni}} | {{method|moderator=Jouni}} | ||
'''Uploading to [[Opasnet Base]]''' helps you understand what data could and should be updated to [[Opasnet Base]] and what the recommended data structures and formats are. For technical instructions how to use the current upload software, see [[Opasnet Base connection]]. For a general description about the database, see [[Opasnet Base]] and for technical details about the database, see [[Opasnet Base structure | '''Uploading to [[Opasnet Base]]''' helps you understand what data could and should be updated to [[Opasnet Base]] and what the recommended data structures and formats are. For technical instructions how to use the current upload software, see [[Opasnet Base connection]]. For a general description about the database, see [[Opasnet Base]] and for technical details about the database, see [[Opasnet Base structure]]. For details about downloading data, see [[Opasnet Base UI]]. | ||
== | == Question == | ||
What data could and should be updated to [[Opasnet Base]] and what are the recommended data structures and formats? | What data could and should be updated to [[Opasnet Base]] and what are the recommended data structures and formats? | ||
== | == Answer == | ||
There are several different tools to upload data to [[Opasnet Base]]. These are first listed and described here, and then more details are given either here or on a separate page. | |||
If the variable is | # '''If you have a small table that you want to show in a wiki page''': [[Table2Base]] is a functionality that uploads a table from an [[Opasnet]] page to [[Opasnet Base]]. <nowiki><t2b></nowiki> tag is used to make the table. By default, the table content replaces any previous content in [[Opasnet Base]] every time when the table is changed and the page saved. | ||
# '''If you have your data in R''': [[Opasnet Base Connection for R]] is a group of [[R]] functions that can easily upload data from models run in the [[R]] environment. | |||
# '''If you have a large data in a file''': [[Special:Opasnet_Base_Import|Opasnet Base Import]] is a tool for uploading data in CSV or XLS files to the Opasnet Base. Registered Opasnet users can use this tool by following the "Upload data" link in the top right corner box on any variable (or other data storing) page. This is explained on more detail on this page. | |||
# '''If you want to collect data from several Opasnet users''': Interface for R code can also be extended to upload data from a questionnaire form on an Opasnet page. This way, the data itself does not stay on the page and can therefore only be seen from the base. See [[R-tools]] for instructions to build an interface. | |||
=== Uploading data with Opasnet Base Import === | |||
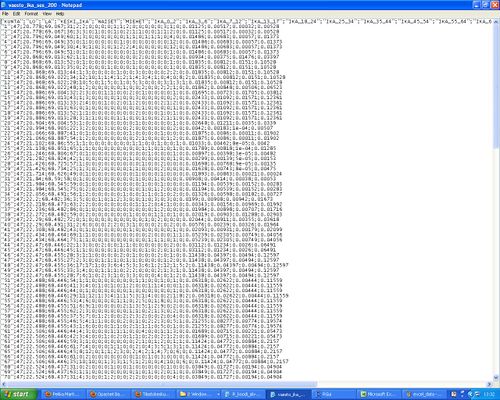
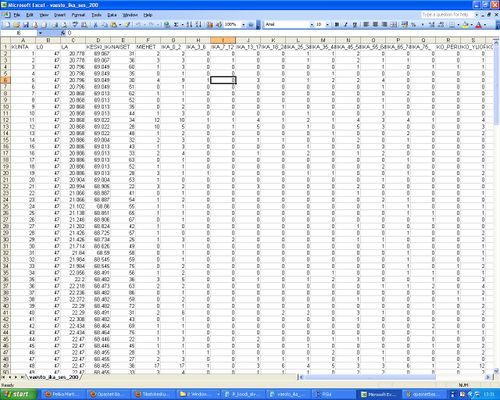
*At the first data was modified from text file to excel file. At the same time the first ID column was removed (see figures 1 and 2), | |||
[[File:Example text data.JPG|thumb|500px|center| Fig 1. Example raw data in text format.]] | |||
[[File:Excel data.JPG|thumb|500px|center|Fig 2. Text data is transformed to excel format. First id column has been removed.]] | |||
*Secondly we went to the opasnet page where the table should be uploaded and take "Upload data". (The page should be variable or method page!!) | |||
If | *In the Opasnet Base Import page all the inputs depends on the data. | ||
**Define Unit (If you have several units write e.g. "misc" | |||
**If data has only one column with results, take mark into "First row contains the indices" | |||
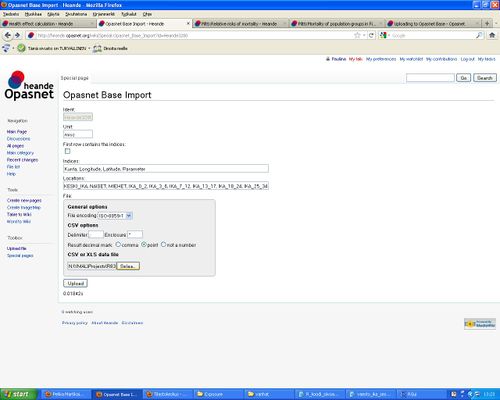
**If data has many columns with results, you have to define Indices and Locations (see Fig 3) Indices are all indices of data (last one is indice for Locations) in the table and Locations are name of result columns. All names must be separated with comma. | |||
**If data is in csv format define CSV inputs. | |||
**Browse data from files | |||
**Upload | |||
[[File:Opasnetbase import example.JPG|thumb|500px|center|Fig 3. Inputs of example data.]] | |||
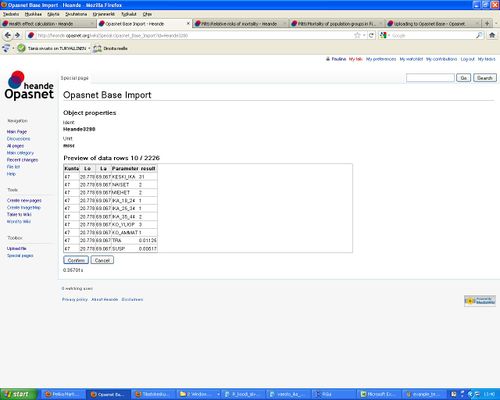
*Confirm uploading (Fig 4.) | |||
* | [[File:Opbase import.JPG|thumb|500px|center|Fig 4. Preview of data rows and confirming of uploading.]] | ||
*Browse uploaded data with Opasnet Base UI (See Fig 5.). | |||
* | [[File:Data uploaded.JPG|thumb|500px|center|Fig 5. Data uploaded successfully.]] | ||
*In the data page "Show the result" shows the data from OpasnetBase (Fig 6) | |||
* | [[File:Data page.JPG|thumb|500px|center|Fig 6. Data page is ready.]] | ||
== Rationale == | |||
This section describes what the inputs are and the different ways they can be formatted for a successful upload. | |||
What are the topics about which data can be uploaded into the Base? Well, basically any topic that provides useful information for any decision-making situation that has societal relevance. This sounds like a very wide definition, and it is. The data may be about which car models are environmentally friendly. It may be about pollutants in food. It may be new ideas about a societally just value-added tax. | |||
What are, then, the data structures that are allowed? Although not all structures are allowed, almost any data can be easily transformed into the structure that is used in [[Opasnet Base]]. The data must be formatted as a two-dimensional table with one observation at each row. Cells of the table may contain either text or numerical values. Columns contain either explanations (or ''independent variables'' in statistics) or the actual observations (or ''dependent variables'' in statistics). This difference is important. Explanations are things that are fixed before the actual observation, while observations are those that are actually measured or observed. See the following table as example. | |||
{| {{prettytable}} | |||
|+An example of a data table. | |||
! City | |||
! Year | |||
! Sex | |||
! Body mass index BMI (kg/m<sup>2</sup>) | |||
! Blood cholesterol (mM) | |||
|---- | |||
|| London|| 2010|| Male|| 20|| 3.31 | |||
|---- | |||
|| London|| 2010|| Male|| 25|| 6.83 | |||
|---- | |||
|| London|| 2010|| Female|| 20|| 5.55 | |||
|---- | |||
|| London|| 2010|| Female|| 30|| 5.42 | |||
|---- | |||
|| London|| 2010|| Female|| 25|| 4.19 | |||
|---- | |||
|| New York|| 2010|| Male|| 22|| 3.33 | |||
|---- | |||
|| New York|| 2010|| Male|| 26|| 5.84 | |||
|---- | |||
|| New York|| 2010|| Female|| 28|| 5.67 | |||
|---- | |||
|| New York|| 2010|| Female|| 26|| 4.52 | |||
|---- | |||
|| New York|| 2010|| Female|| 24|| 5.67 | |||
|---- | |||
|} | |||
The table seems unambiguous at the first glance, but it is impossible to interpret it correctly without knowing, which columns are explanations and which are observations. This may be a study performed in London and New York in 2010, where random people were asked for a blood test. In this case, city and year are explanations, and other columns are observations. However, the data may as well be summary statistics from a larger study, where the studied individuals were grouped in these cities based on their sex and body mass index (BMI), and the mean cholesterol in each group is the only observation column. (The data implies that London used BMI groups 5 kg/m<sup>2</sup> wide, while New York used BMI groups kg/m<sup>2</sup> wide, but you cannot know based on the data only.) | |||
However, if you know which columns are explanations and which are observations, you can actually deduce many important aspects of the design of the study from which the data came. Of course many things must be explained elsewhere like how people were selected and what the base population studied was. | |||
Another important feature of the data is, whether it is deterministic or probabilistic. With deterministic data, it is assumed that each row is an independent piece of information. With probabilistic data, it is assumed that there are random draws from a pool of potential observations (like an urn full of balls with different colours, each having the same probability of being picked). However, all observations are not picked from the same pool, but from several pools uniquely defined by the explanation columns. | |||
Let's assume that we look at the table above and learn that it is a probabilistic data with two explanation columns. We then know that people were randomly picked from either London or New York in 2010 (explanation columns are always the first ones on the left side). In London, two happened to be males and three females, with measured BMIs and cholesterol levels. Thus, there are five observations from the pool defined by "London 2010", and also five observations from "New York 2010." These are numbered 1..5. If the data is deterministic, the observation number is 0 for all rows. | |||
== See also == | |||
- | {{Opasnet Base}}<!-- __OBI_TS:1430934755 --> | ||
Latest revision as of 17:52, 6 May 2015
| Moderator:Jouni (see all) |
|
|
| Upload data
|
Uploading to Opasnet Base helps you understand what data could and should be updated to Opasnet Base and what the recommended data structures and formats are. For technical instructions how to use the current upload software, see Opasnet Base connection. For a general description about the database, see Opasnet Base and for technical details about the database, see Opasnet Base structure. For details about downloading data, see Opasnet Base UI.
Question
What data could and should be updated to Opasnet Base and what are the recommended data structures and formats?
Answer
There are several different tools to upload data to Opasnet Base. These are first listed and described here, and then more details are given either here or on a separate page.
- If you have a small table that you want to show in a wiki page: Table2Base is a functionality that uploads a table from an Opasnet page to Opasnet Base. <t2b> tag is used to make the table. By default, the table content replaces any previous content in Opasnet Base every time when the table is changed and the page saved.
- If you have your data in R: Opasnet Base Connection for R is a group of R functions that can easily upload data from models run in the R environment.
- If you have a large data in a file: Opasnet Base Import is a tool for uploading data in CSV or XLS files to the Opasnet Base. Registered Opasnet users can use this tool by following the "Upload data" link in the top right corner box on any variable (or other data storing) page. This is explained on more detail on this page.
- If you want to collect data from several Opasnet users: Interface for R code can also be extended to upload data from a questionnaire form on an Opasnet page. This way, the data itself does not stay on the page and can therefore only be seen from the base. See R-tools for instructions to build an interface.
Uploading data with Opasnet Base Import
- At the first data was modified from text file to excel file. At the same time the first ID column was removed (see figures 1 and 2),
- Secondly we went to the opasnet page where the table should be uploaded and take "Upload data". (The page should be variable or method page!!)
- In the Opasnet Base Import page all the inputs depends on the data.
- Define Unit (If you have several units write e.g. "misc"
- If data has only one column with results, take mark into "First row contains the indices"
- If data has many columns with results, you have to define Indices and Locations (see Fig 3) Indices are all indices of data (last one is indice for Locations) in the table and Locations are name of result columns. All names must be separated with comma.
- If data is in csv format define CSV inputs.
- Browse data from files
- Upload
- Confirm uploading (Fig 4.)
- Browse uploaded data with Opasnet Base UI (See Fig 5.).
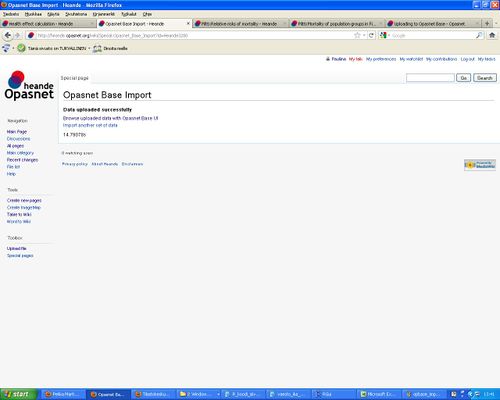
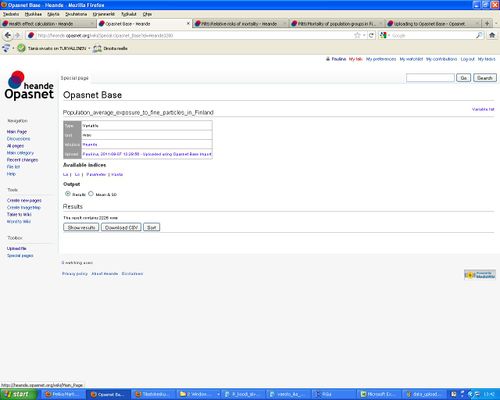
- In the data page "Show the result" shows the data from OpasnetBase (Fig 6)
Rationale
This section describes what the inputs are and the different ways they can be formatted for a successful upload.
What are the topics about which data can be uploaded into the Base? Well, basically any topic that provides useful information for any decision-making situation that has societal relevance. This sounds like a very wide definition, and it is. The data may be about which car models are environmentally friendly. It may be about pollutants in food. It may be new ideas about a societally just value-added tax.
What are, then, the data structures that are allowed? Although not all structures are allowed, almost any data can be easily transformed into the structure that is used in Opasnet Base. The data must be formatted as a two-dimensional table with one observation at each row. Cells of the table may contain either text or numerical values. Columns contain either explanations (or independent variables in statistics) or the actual observations (or dependent variables in statistics). This difference is important. Explanations are things that are fixed before the actual observation, while observations are those that are actually measured or observed. See the following table as example.
| City | Year | Sex | Body mass index BMI (kg/m2) | Blood cholesterol (mM) |
|---|---|---|---|---|
| London | 2010 | Male | 20 | 3.31 |
| London | 2010 | Male | 25 | 6.83 |
| London | 2010 | Female | 20 | 5.55 |
| London | 2010 | Female | 30 | 5.42 |
| London | 2010 | Female | 25 | 4.19 |
| New York | 2010 | Male | 22 | 3.33 |
| New York | 2010 | Male | 26 | 5.84 |
| New York | 2010 | Female | 28 | 5.67 |
| New York | 2010 | Female | 26 | 4.52 |
| New York | 2010 | Female | 24 | 5.67 |
The table seems unambiguous at the first glance, but it is impossible to interpret it correctly without knowing, which columns are explanations and which are observations. This may be a study performed in London and New York in 2010, where random people were asked for a blood test. In this case, city and year are explanations, and other columns are observations. However, the data may as well be summary statistics from a larger study, where the studied individuals were grouped in these cities based on their sex and body mass index (BMI), and the mean cholesterol in each group is the only observation column. (The data implies that London used BMI groups 5 kg/m2 wide, while New York used BMI groups kg/m2 wide, but you cannot know based on the data only.)
However, if you know which columns are explanations and which are observations, you can actually deduce many important aspects of the design of the study from which the data came. Of course many things must be explained elsewhere like how people were selected and what the base population studied was.
Another important feature of the data is, whether it is deterministic or probabilistic. With deterministic data, it is assumed that each row is an independent piece of information. With probabilistic data, it is assumed that there are random draws from a pool of potential observations (like an urn full of balls with different colours, each having the same probability of being picked). However, all observations are not picked from the same pool, but from several pools uniquely defined by the explanation columns.
Let's assume that we look at the table above and learn that it is a probabilistic data with two explanation columns. We then know that people were randomly picked from either London or New York in 2010 (explanation columns are always the first ones on the left side). In London, two happened to be males and three females, with measured BMIs and cholesterol levels. Thus, there are five observations from the pool defined by "London 2010", and also five observations from "New York 2010." These are numbered 1..5. If the data is deterministic, the observation number is 0 for all rows.
See also
| Pages related to Opasnet Base |
Opasnet Base · Uploading to Opasnet Base · Data structures in Opasnet · Opasnet Base UI · Modelling in Opasnet · Special:Opasnet Base Import · Opasnet Base Connection for R (needs updating) · Converting KOPRA data into Opasnet Base · Poll · Working with sensitive data · Saved R objects |
| Pages related to the 2008-2011 version of Opasnet Base |
Opasnet base connection for Analytica · Opasnet base structure · Related Analytica file (old version File:Transferring to result database.ANA) · Analytica Web Player · Removed pages and other links · Standard run · OpasnetBaseUtils |