File list
This special page shows all uploaded files.
| Date | Name | Thumbnail | Size | Description | Versions |
|---|---|---|---|---|---|
| 07:53, 27 June 2011 | Manual for ExpoPlatform.odf (file) | 28 KB | 1 | ||
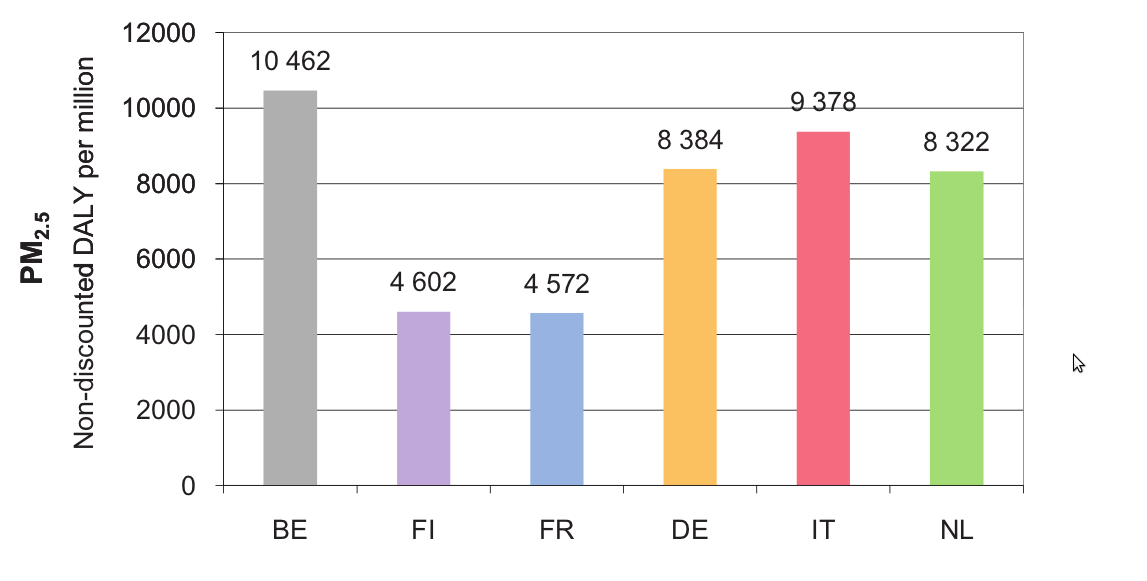
| 08:15, 8 June 2011 | PM2.5daily.png (file) |  |
38 KB | 1 | |
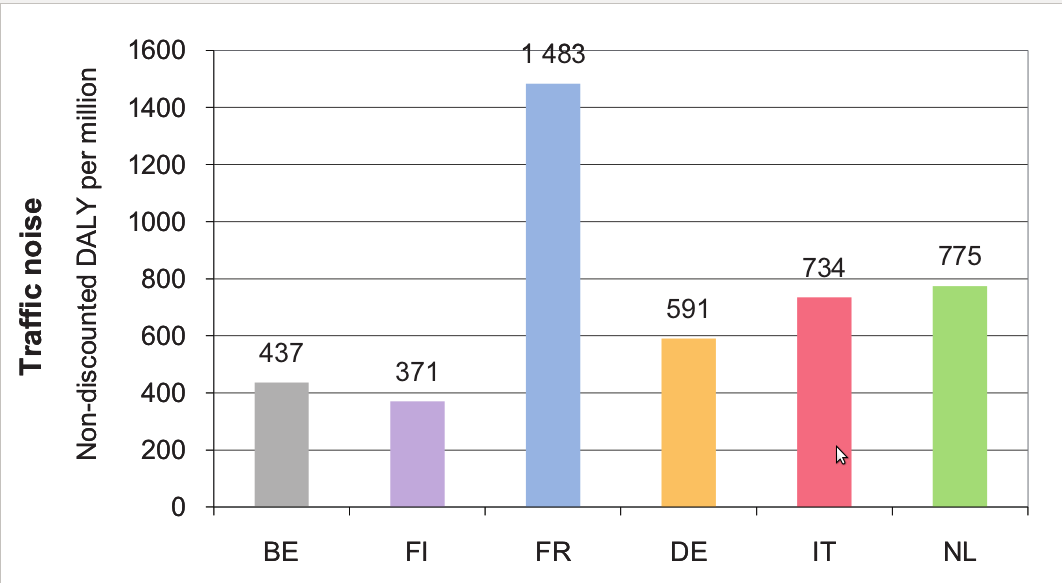
| 08:09, 8 June 2011 | Trafficnoisedaily.png (file) |  |
39 KB | 1 | |
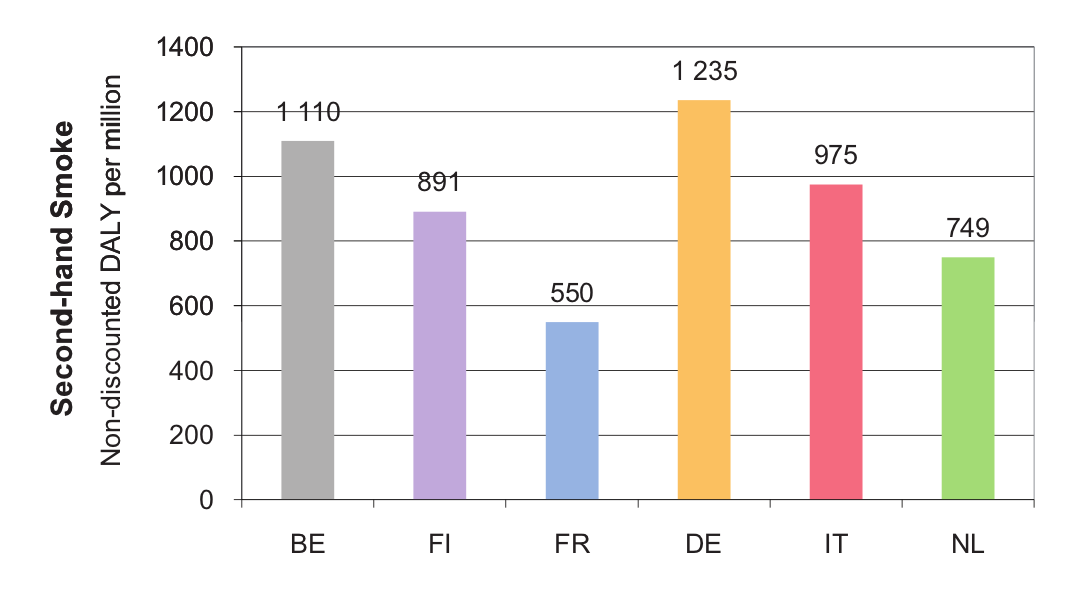
| 08:03, 8 June 2011 | Secondhandsmokedaily.png (file) |  |
42 KB | 1 | |
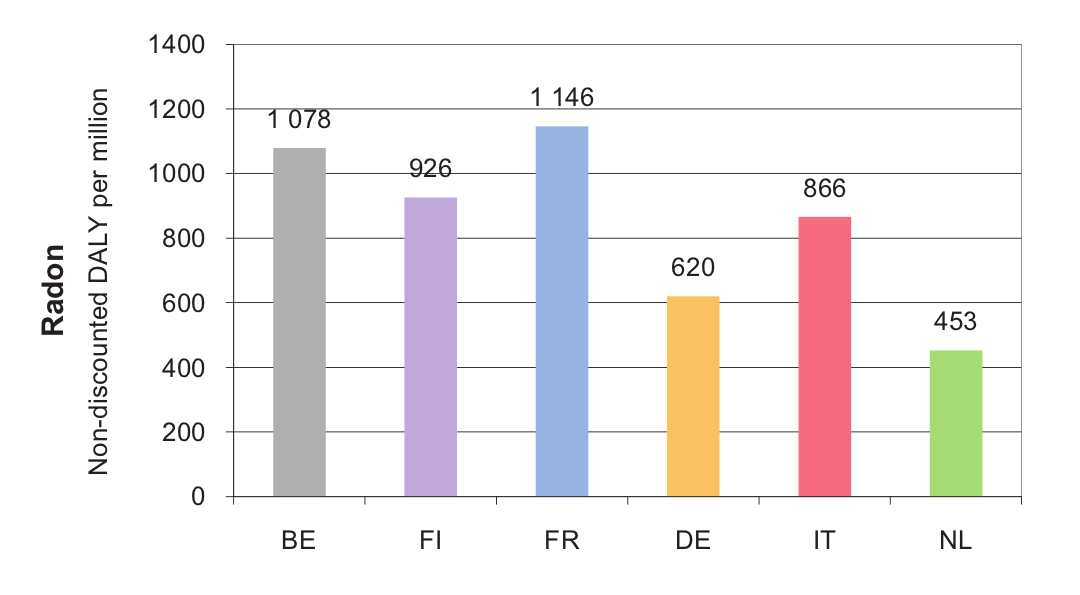
| 07:59, 8 June 2011 | Radondaily.jpg (file) |  |
37 KB | 1 | |
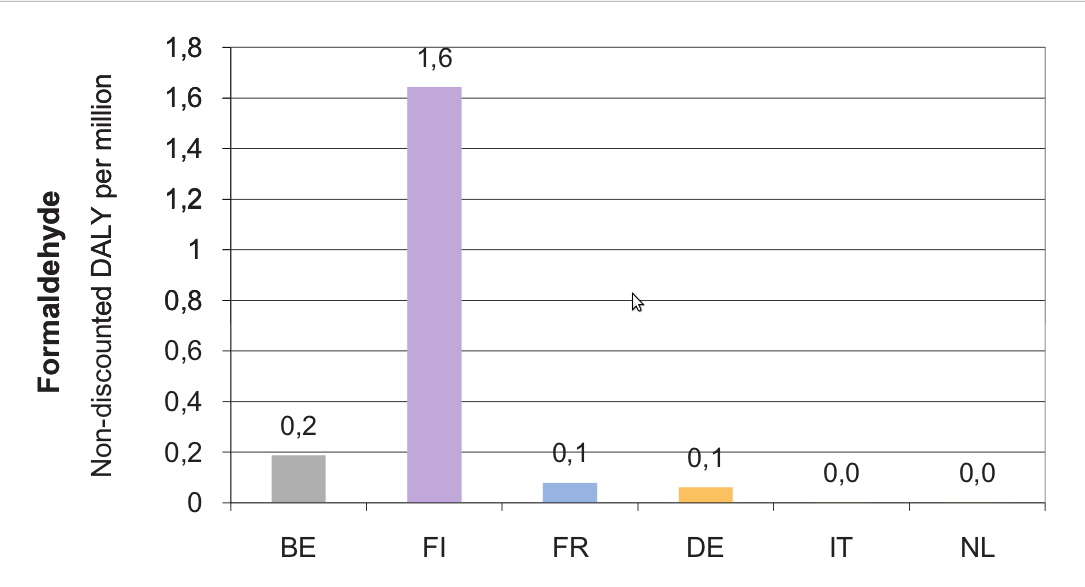
| 07:55, 8 June 2011 | Formaldehydedaly.png (file) |  |
37 KB | 1 | |
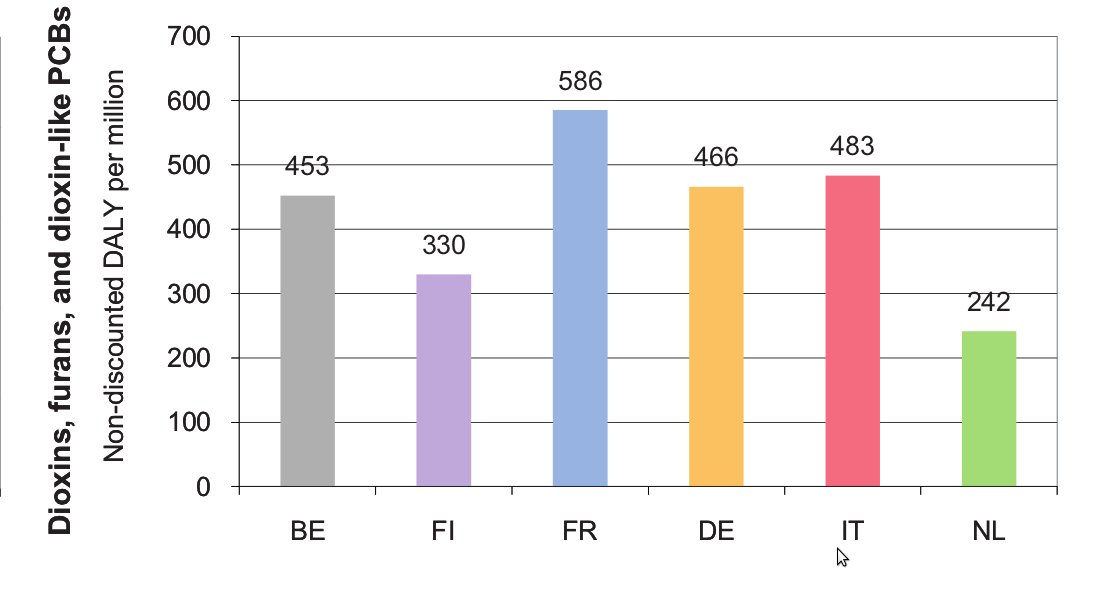
| 07:53, 8 June 2011 | Dioxinsdaly.png (file) |  |
45 KB | 1 | |
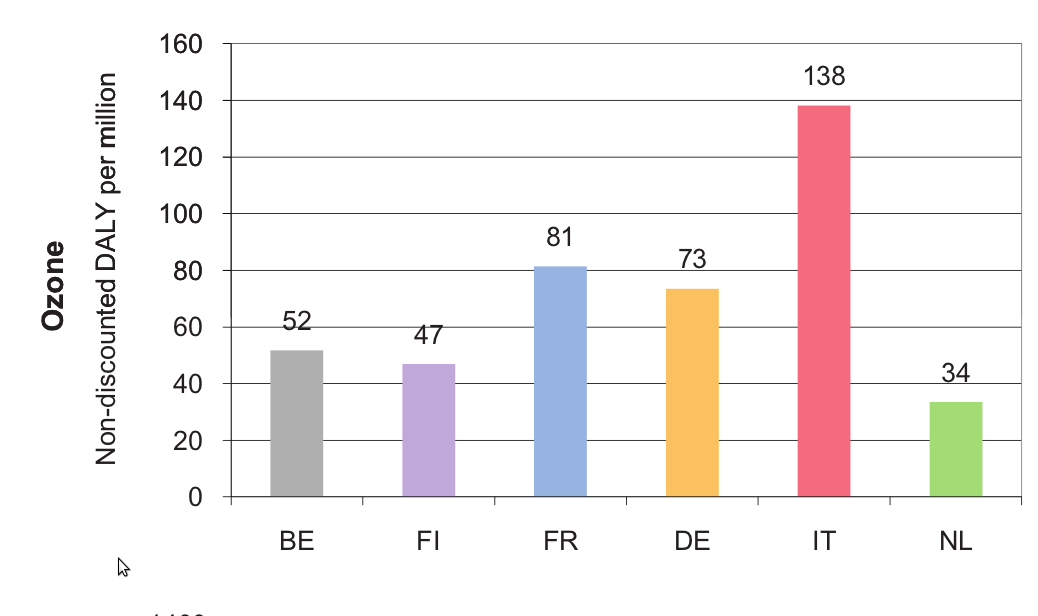
| 07:50, 8 June 2011 | Ozonedaily.png (file) |  |
36 KB | 1 | |
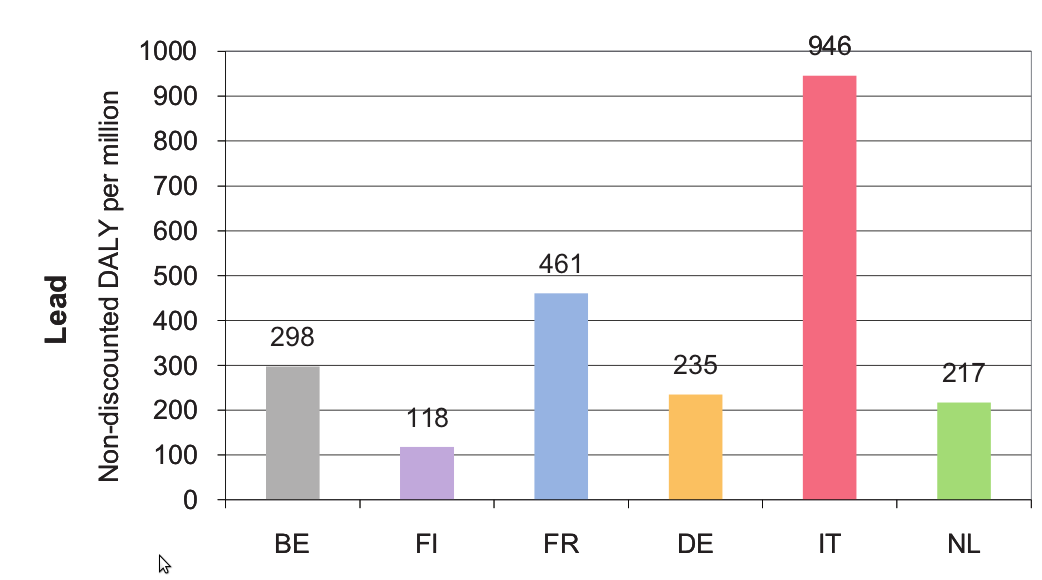
| 07:48, 8 June 2011 | Leaddaily.png (file) |  |
39 KB | 1 | |
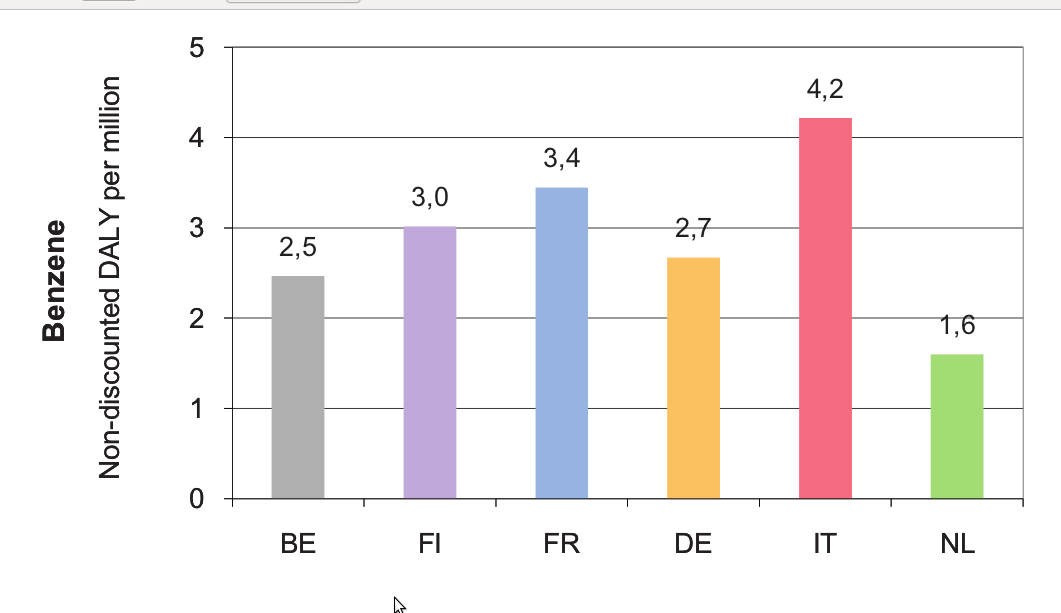
| 07:42, 8 June 2011 | Benzenedaly.png (file) |  |
30 KB | 1 | |
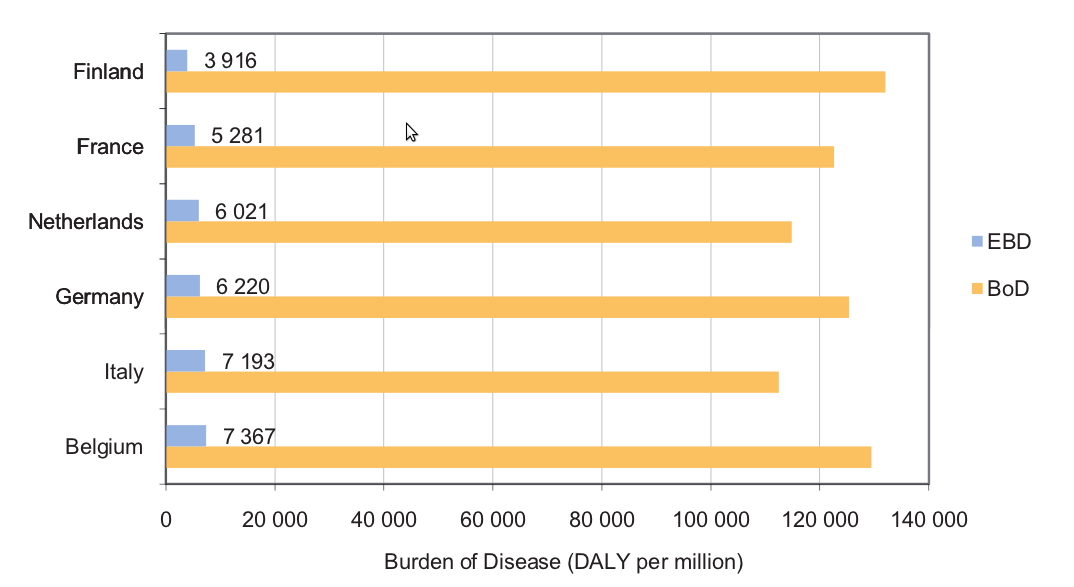
| 11:01, 7 June 2011 | BurdenofdiseaseDALY.png (file) |  |
38 KB | Environmental fraction attributable to the studied nine stressors (in blue) of the total burden of disease in the participating countries (discounted age-weighted DALYs per million people). | 1 |
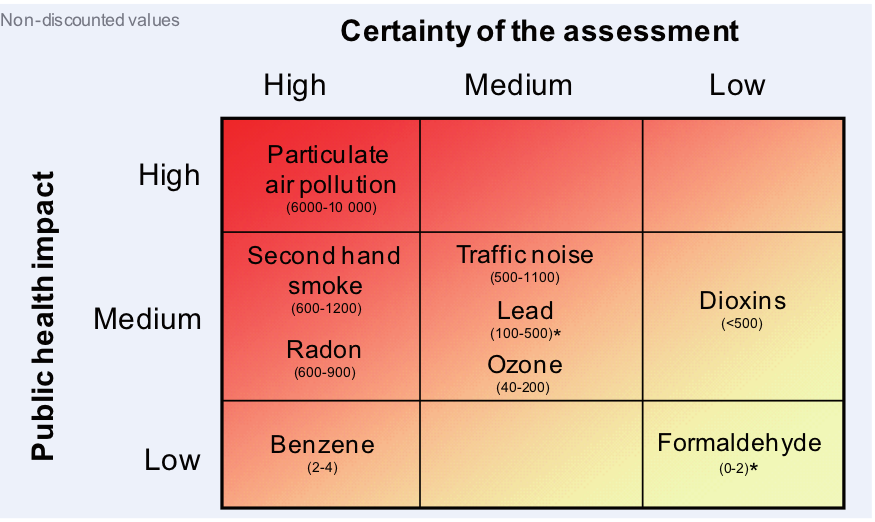
| 10:16, 6 June 2011 | Non-discountedvalues.png (file) |  |
51 KB | The quantitative results of the environmental burden of disease calculations per stressor and health endpoint, averaged over the six countries, are presented in Table 4-1. The total results aggregated per stressor are shown in Table 4-2. | 1 |
| 09:29, 6 June 2011 | Non-discounted values.png (file) |  |
279 KB | The quantitative results of the environmental burden of disease calculations per stressor and health endpoint, averaged over the six countries, are presented in Table 4-1. The total results aggregated per stressor are shown in Table 4-2. | 1 |
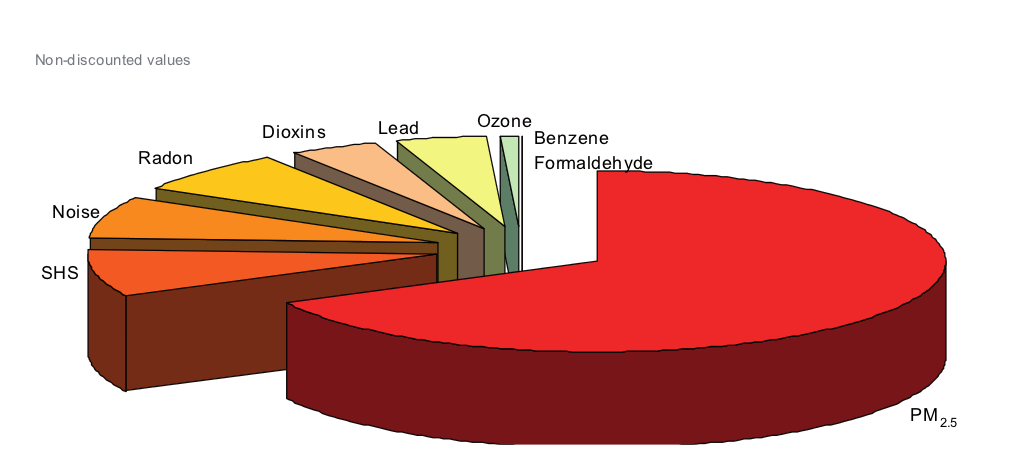
| 09:19, 6 June 2011 | Relativepublichealthimpact.png (file) |  |
279 KB | Figure shows the burden of disease related to the nine stressors proportional to each other. As can be seen from this figure, particulate matter (using PM2.5 as indicator) is estimated to be the leading factor associated with 6.000 to 10.000 non-discounte | 2 |