File list
This special page shows all uploaded files.
| Date | Name | Thumbnail | Size | Description | Versions |
|---|---|---|---|---|---|
| 13:39, 25 March 2015 | Management of assessments and decision making.ppt (file) | 468 KB | Presented on DARM 2015. | 4 | |
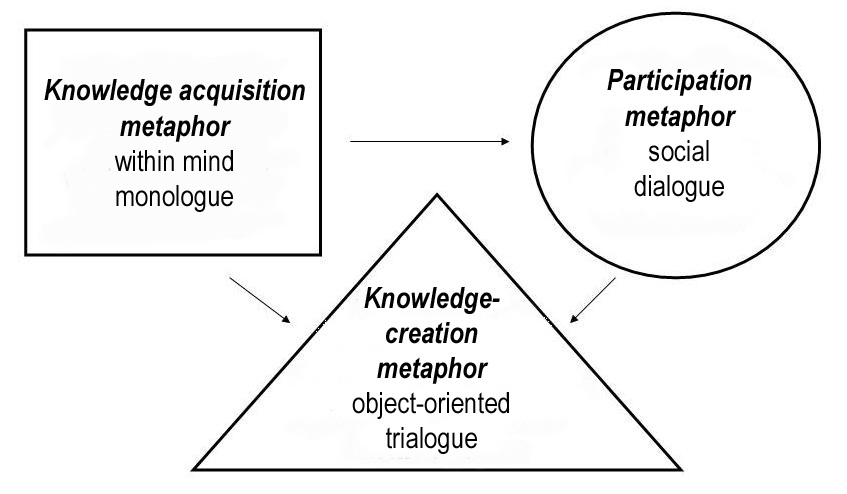
| 02:31, 8 April 2013 | Three metaphors of learning.PNG (file) |  |
68 KB | 2 | |
| 09:09, 22 January 2013 | Assessment questions.ppt (file) | 794 KB | The slides on shared understanding somewhat clarified. | 3 | |
| 14:04, 13 January 2013 | Puijo forest management.ppt (file) | 451 KB | Minor improvements. | 2 | |
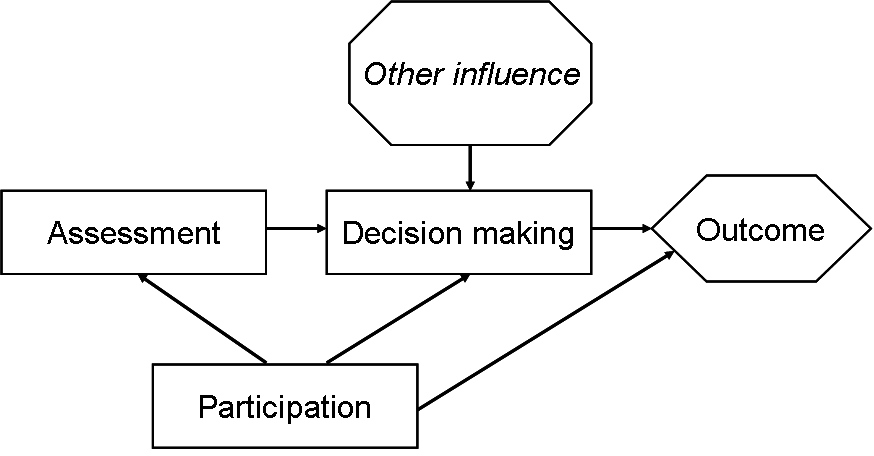
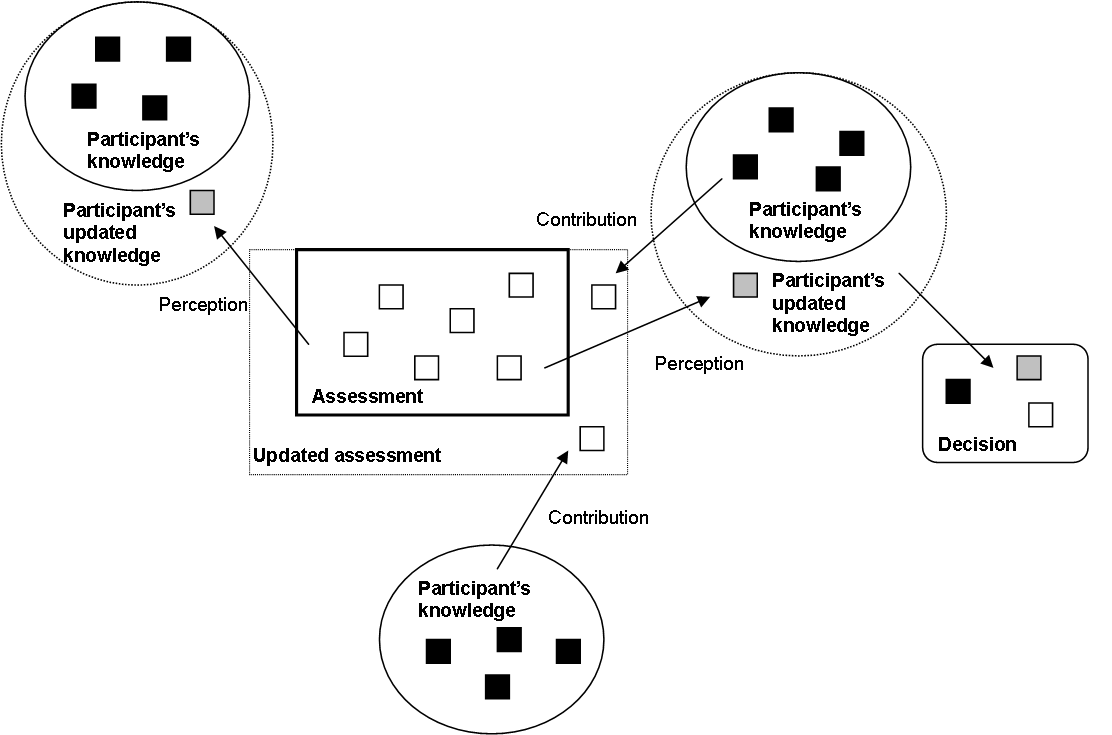
| 13:36, 19 December 2011 | Participation, assessment and decision making.PNG (file) |  |
18 KB | Relationships between participation, assessment, policy making, and their outcomes. Arrows depict alternative routes for potential influence from participation to outcomes. | 1 |
| 05:45, 8 April 2011 | Overview of DA, RM, OA and ORM.ppt (file) | 394 KB | A couple of minimal edits while browsing through. | 3 | |
| 13:06, 31 March 2011 | Risk management - Facilitation of (open) risk management.ppt (file) | 1.4 MB | collective knowledge creation + pragmatic knowledge services | 3 | |
| 11:14, 31 March 2011 | Risk management - a social learning perspective.ppt (file) | 426 KB | Collective knowledge creation slides moved to Risk management - Facilitation of (open) risk management | 4 | |
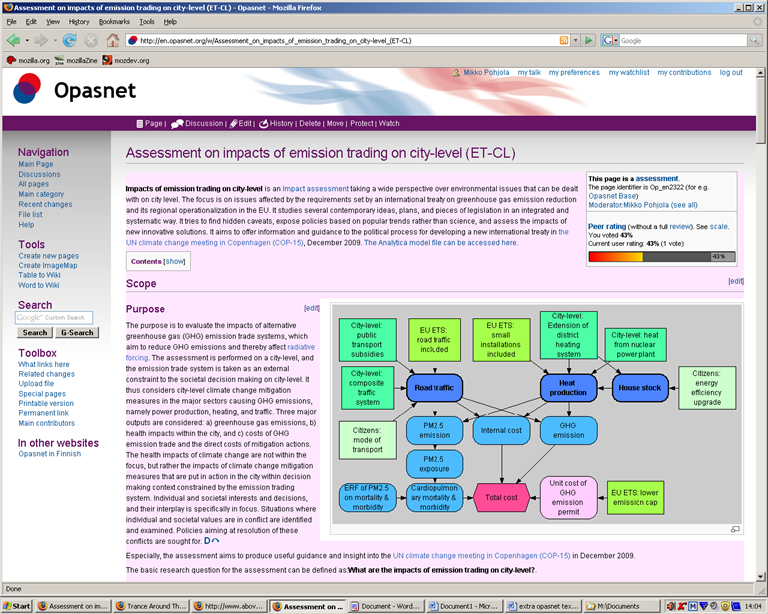
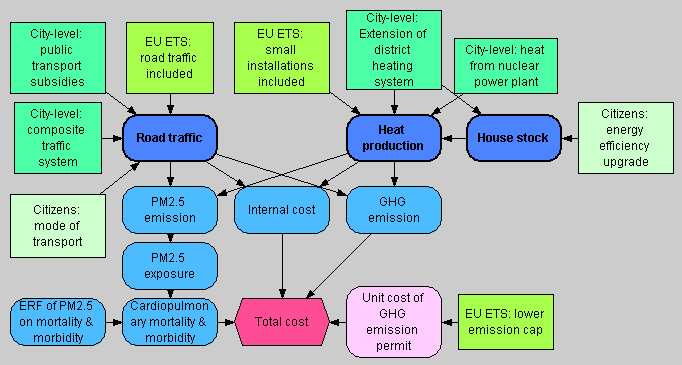
| 15:24, 23 March 2011 | ET-CL.PNG (file) |  |
358 KB | A screen shot from Opasnet representing an assessment page on impacts of emission trading on city-level climate policy. | 1 |
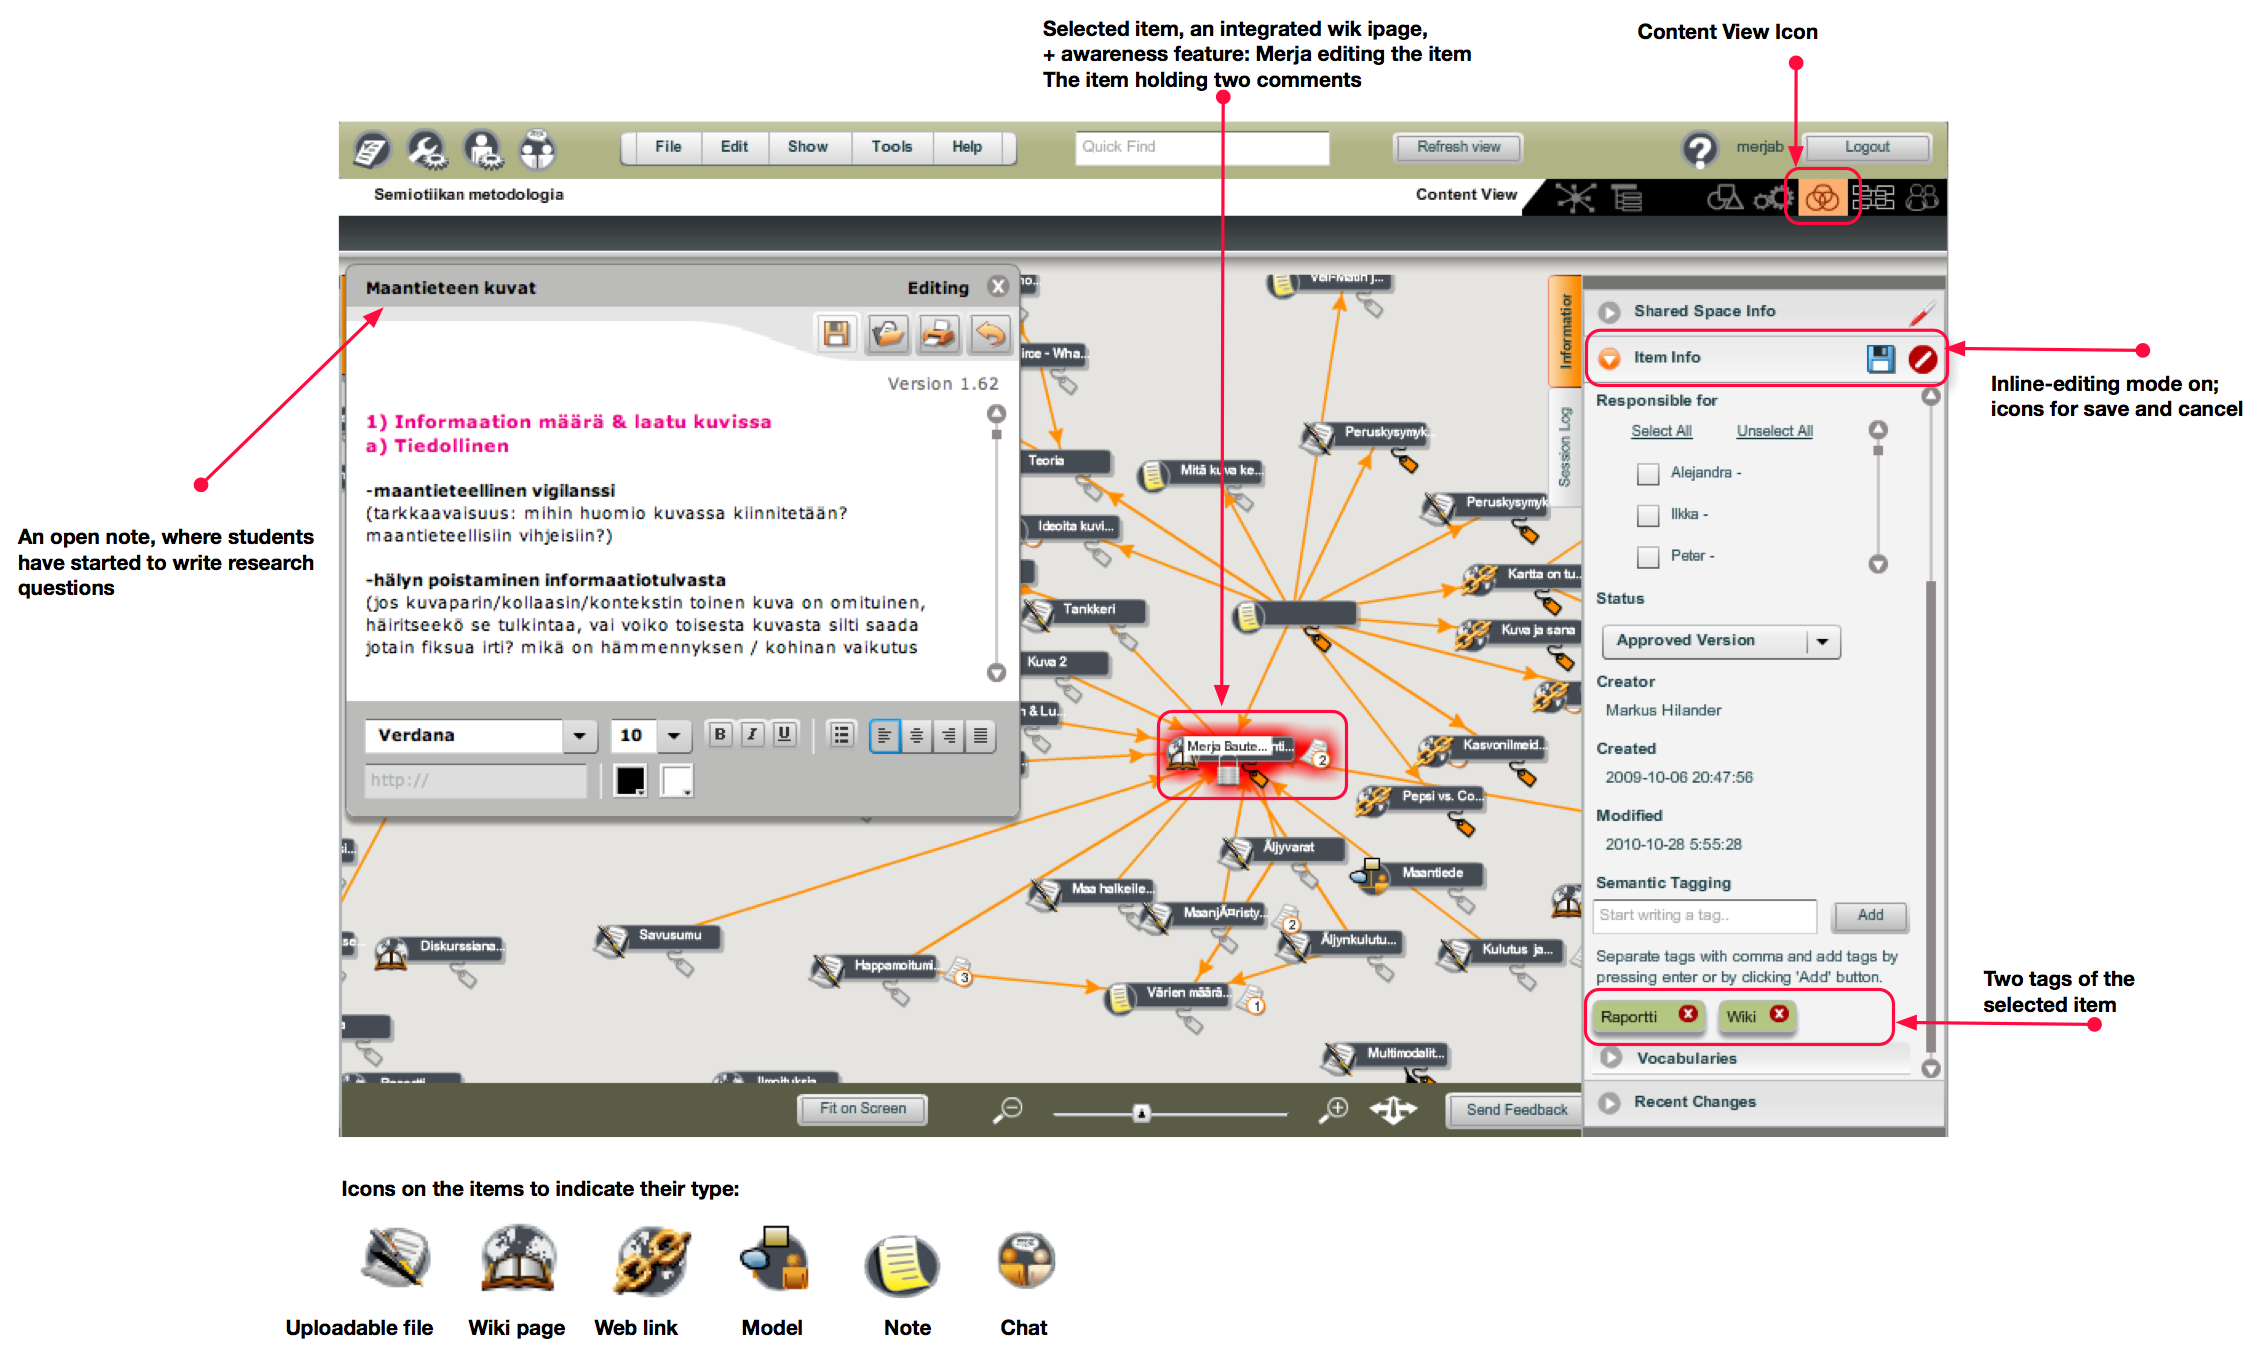
| 15:21, 23 March 2011 | ContentView.png (file) |  |
853 KB | An image representing the Content View in the Knowledge Practices Environment (KPE) system for collaborative learning. | 1 |
| 09:53, 22 March 2011 | Assessment performance.ppt (file) | 1.15 MB | The presentation that was actually presented. | 4 | |
| 14:03, 3 January 2011 | Internalization and externalization.PNG (file) |  |
37 KB | 2 | |
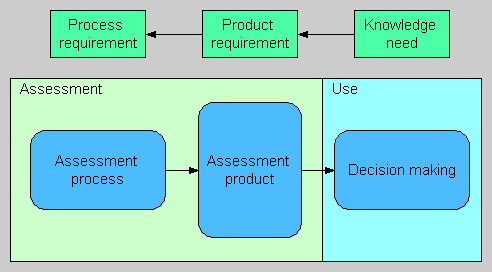
| 11:57, 10 November 2009 | Assessment push and pull.PNG (file) |  |
7 KB | Describes the relationships between assessment process, assessment product and use of assessment product. | 1 |
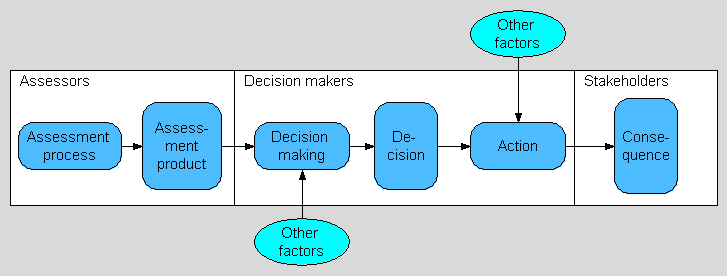
| 12:05, 4 June 2009 | RA-SH chain.PNG (file) |  |
11 KB | from RA to assessment | 2 |
| 10:27, 20 May 2009 | Road traffic in HMA.ANA (file) | 106 KB | Traffic module of ET-CL model. | 1 | |
| 10:26, 20 May 2009 | House stock of HMA.ANA (file) | 13 KB | House stock module of ET-CL model. | 1 | |
| 10:25, 20 May 2009 | Heat production in HMA.ANA (file) | 8 KB | Heat production module of ET-CL assessment. | 1 | |
| 08:05, 19 May 2009 | CarbonTrade city-level.ANA (file) | 144 KB | 11 | ||
| 09:54, 8 May 2009 | ET-CL model overview.PNG (file) |  |
19 KB | 1 | |
| 13:21, 26 March 2009 | Assessments -science-based decision support part II.ppt (file) | 359 KB | 1 | ||
| 13:19, 26 March 2009 | Evaluating assessment performance.ppt (file) | 351 KB | 3 | ||
| 13:13, 26 March 2009 | Assessments -science-based decision support.ppt (file) | 526 KB | 3 | ||
| 13:09, 5 May 2008 | General processs.ANA (file) | 2 KB | The Analytica-file used to create the general process image. | 1 | |
| 13:08, 5 May 2008 | General processes.PNG (file) |  |
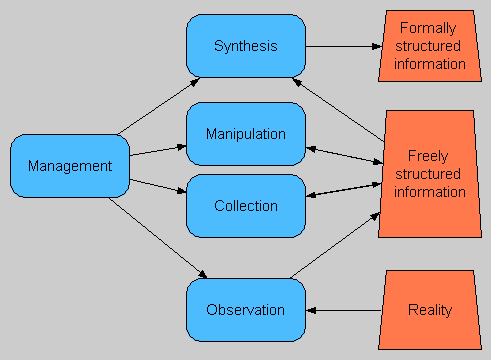
10 KB | General sub-processes taking place within environmental health assessment process. | 1 |
| 10:41, 21 April 2008 | Context Process and Product.ANA (file) | 2 KB | 2 | ||
| 10:41, 21 April 2008 | Context Process Product.ANA (file) | 2 KB | 1 | ||
| 10:45, 27 March 2008 | Context Process Product.PNG (file) |  |
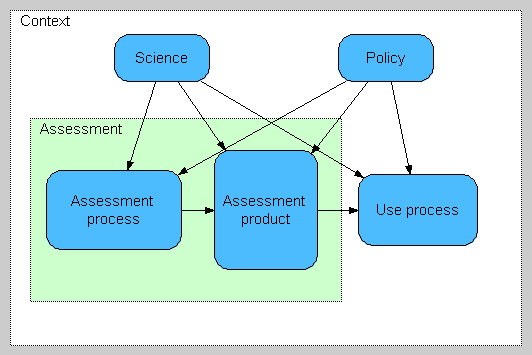
10 KB | An image presenting the general assessment framework. | 1 |
| 08:40, 22 February 2008 | ORA workshop lecture8 2008.ppt (file) | 360 KB | final | 2 | |
| 06:04, 21 February 2008 | ORA workshop lecture7 2008.ppt (file) | 485 KB | final | 5 | |
| 06:15, 20 February 2008 | ORA workshop lecture5 2008.ppt (file) | 1.32 MB | final | 5 | |
| 05:41, 19 February 2008 | ORA workshop lecture3 2008.ppt (file) | 132 KB | 5 | ||
| 06:06, 18 February 2008 | ORA workshop lecture2.ppt (file) | 522 KB | 6 | ||
| 09:21, 8 February 2008 | Congestion charge case study.ANA (file) | 16 KB | The Analytica file that was used to create Image:Congestion charge case study.ANA | 1 | |
| 09:20, 8 February 2008 | Congestion charge case study.PNG (file) |  |
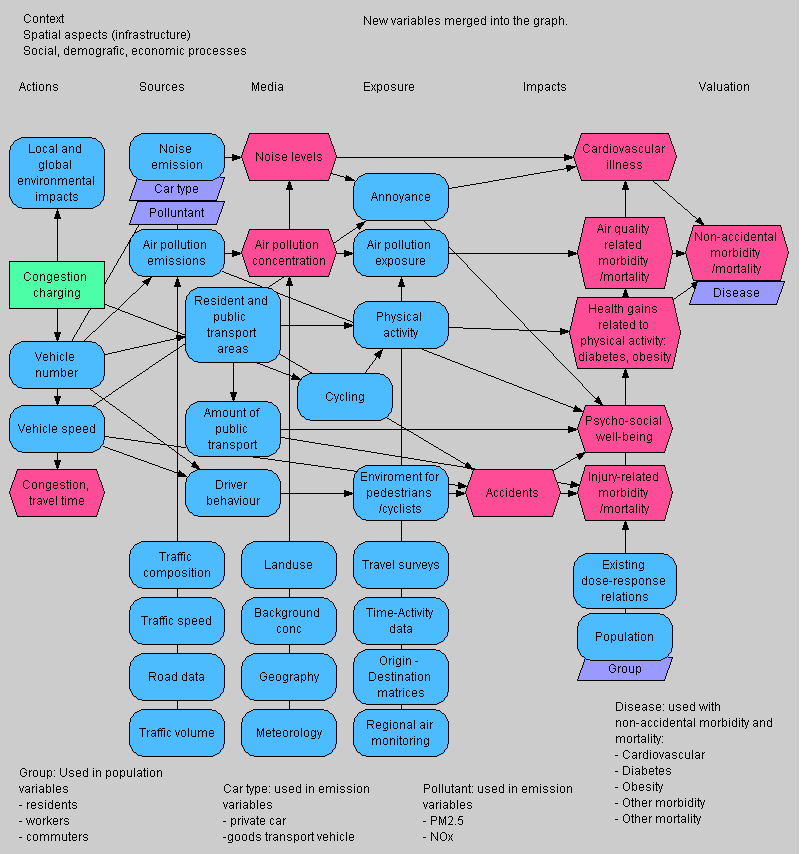
48 KB | An example of a causal diagram. | 1 |
| 09:10, 8 February 2008 | Indicators and proxies.ANA (file) | 3 KB | The Analytica file used to create Image:Indicators and proxies.PNG | 1 | |
| 09:08, 8 February 2008 | Indicators and proxies.PNG (file) |  |
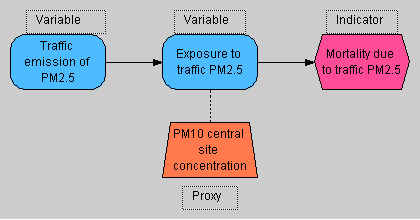
6 KB | Diagram explaining the difference between indicators and proxies. | 1 |
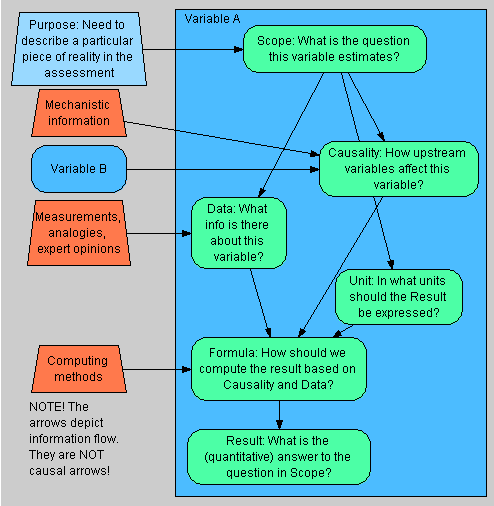
| 09:01, 8 February 2008 | Variable definition.PNG (file) |  |
19 KB | A diagram explaining the (non-causal) linkages between different types of information and different sub-attributes within the definition attribute of a variable. | 1 |
| 08:48, 8 February 2008 | Aarhus Convention 1998.pdf (file) | 50 KB | CONVENTION ON ACCESS TO INFORMATION, PUBLIC PARTICIPATION IN DECISION-MAKING AND ACCESS TO JUSTICE IN ENVIRONMENTAL MATTERS done at Aarhus, Denmark, on 25 June 1998 | 1 | |
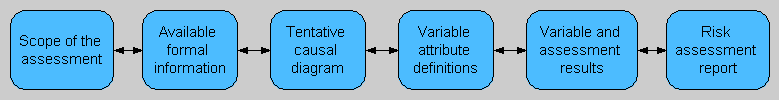
| 08:25, 8 February 2008 | Assessment process.PNG (file) | 6 KB | A schematic representation of assessment process described as a step-by-step evolution of the assessment product. | 1 | |
| 08:09, 8 February 2008 | General properties of good RA.ANA (file) | 6 KB | The Analutica file used to create Image:General properties of good RA graph.PNG | 1 | |
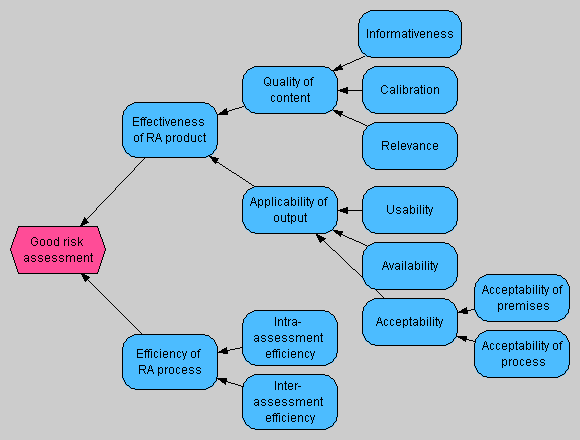
| 08:08, 8 February 2008 | General properties of good RA graph.PNG (file) |  |
15 KB | The diagram representing the properties of good assessments and their relations to the overall assessment (product + process). | 1 |
| 05:53, 28 January 2008 | Tainio Gasbus RiskAnalysis 2004.pdf (file) | 102 KB | 1 | ||
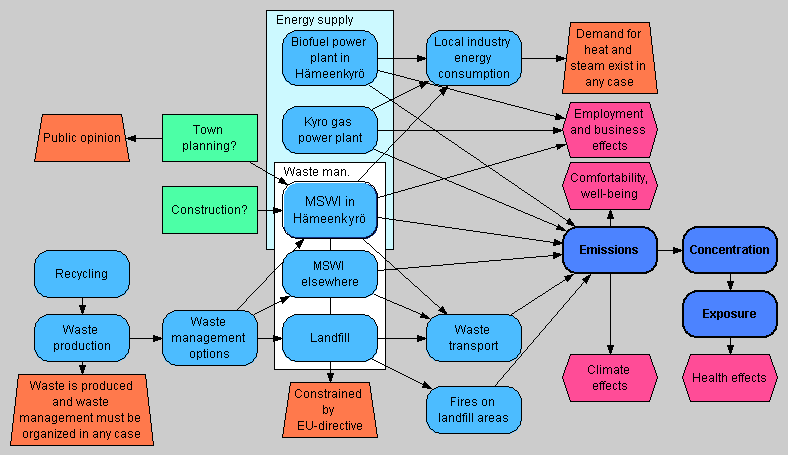
| 10:54, 19 October 2006 | Hameenkyropyrkilo.PNG (file) |  |
27 KB | updated version of the english chart. | 5 |
| 05:55, 15 September 2006 | TCA in groundwater.ppt (file) | 43 KB | 1 |