Societal costs of personal trips in the Helsinki metropolitan area
| Moderator:Nobody (see all) Click here to sign up. |
|
|
| Upload data
|
Scope
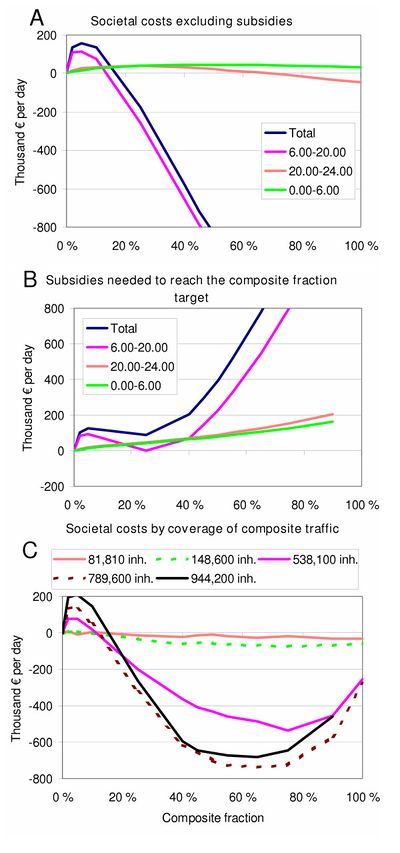
Different costs and pressures caused by the traffic activities. Costs are limited to those that can be calculated from vehicle number, km driven, average waiting time, peak vehicle number per link, or parking places needed. Indirect costs are included.
Definition
Data
This module calculates various pressures of different traffic scenarios. The estimates are based on Outputs node (which has been calculated beforehand due to slow calculations) and the numbers are stored in Static nodes). The outputs of each scenario are indexed (when relevant) by period (day, evening, night); zone (Helsinki downtown, other centre, suburb), length of trip (less or more than 5 km), and vehicle type (8-seat or 4-seat vehicle with of without transfer, or car).
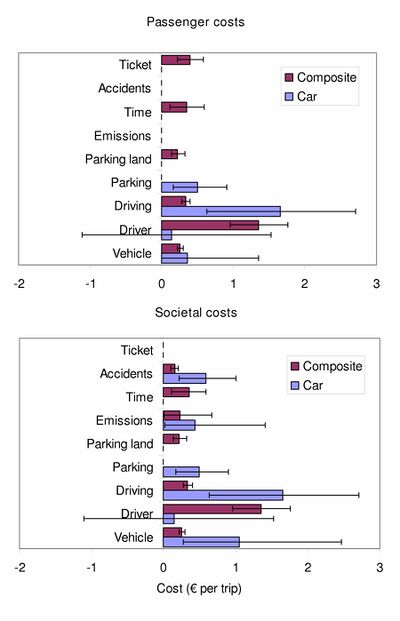
Costs are separately calculated for the passenger and the society. Some costs affect these stakeholders differently, such as fine particle and carbon dioxide emissions: they are calculated as societal costs only, not as costs to a passenger.[1]
Cost elements
This module contains the detailed descriptions of the unit costs and other input variables that are used to calculate the pressures of each scenario. The values used are dependent on the context. For example, the car price is the price that a random new car would cost, and it has therefore large uncertainty. On the other hand, the price of a 4-seat composite vehicle is the average price a taxi-style car would cost in Finland, and the confidence intervals are narrower because there is no individual uncertainty. This is because the price of an individual car affects the costs of individual car trips, while the cost of a composite trip is dependent on the total cost of vehicles to the service provider.
- Vehicle price
- Fuel consumption
- Fuel price
- Car maintenance
- Car occupancy
- Driver salary
- Vehicle lifetime
- PM unit lethality
- Emission unit cost
- Parking space
- Group size
- Rush delay
- Trips per car
- Ticket
- Time unit cost
- Parking price
- Accident costs
- Accidents
- Emission factor[1]
Endpoints
The following endpoints are considered (see Table 1):
- Fraction of composite trips without change (%)
- Vehicles needed (number)
- Parking places need (number)
- Average vehicle flow on the 30 most busy roads (vehicles/h at 8.00-9.00 AM)
- Fine particle (<2.5 µm of diameter) emissions (kg per day)
- Carbon dioxide emissions (ton per day)
- Driver salaries (thousand e per day)
- Vehicle capital and operational costs (thousand e per day)
- Time cost (thousand e per day)
- Average car trip cost to passenger (e per trip)
- Expected composite trip cost to passenger (e per trip)
The following costs are taken into account for passenger (P) or societal (S) costs:
- Vehicle capital cost (P+S)
- Driver salary cost (P+S)
- Driving cost (fuel) (P+S)
- Parking (parking fees for individual drivers) (P)
- Parking land (opportunity cost of reserving land to parking purposes) (P+S)
- Emissions (fine particles and carbon dioxide causing health and climate change effects, respectively (S)
- Time for waiting composite vahicles, time spent in traffic jams (P+S)
- Accidents (an option only, not used in the current model)
- Ticket (profit for composite service provider) (P)
The module has a submodule Cost elements. It contains the detailed descriptions of the unit costs and other input variables that are used to calculate the pressures of each scenario. The values used are dependent on the stakeholder. For example, the car price is the price that a random new car would cost, and it has therefore large uncertainty. On the other hand, the price of a 4-seat composite vehicle is the average price a taxi-style car would cost in Finland, and the confidence intervals are narrower because there is no individual uncertainty. This is because the price of an individual car affects the costs of individual car trips, while the cost of composite trip is dependent on the total cost of vehicles.
Variation between individuals has been separately estimated for three variables: how passengers evaluate the capital costs of owning a car; how passengers are willing to pay for either the right to drive themselves or to not need to drive; and how many passengers are traveling together.
Dependencies
Unit
€ or €/trip


