Intake fractions of PM
| Moderator:Jouni (see all) |
|
|
| Upload data
|
Contents
Question
How to calculate exposure based on intake fractions of airborne particulate matter for different emission sources and locations?
Answer
Intake fraction (iF) is the fraction of an emission that is ultimately breathed by someone in the target population. With fine particles, it is often in the range of one in a million, but variation is large. It can be used as a shortcut for calculating exposures in a situation where actual atmospheric fate and transport modelling is not feasible. For fine particles, there is fairly good understanding of the magnitudes of intake fractions in different situations. [1] Therefore, they have been successfully used in many assessments.
Intake fraction is defined as
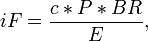 where
where
- iF = intake fraction (unitless after proper unit conversions)
- c = exposure concentratíon of the population (µg/m3)
- P = population size
- BR = breating rate, usually a nominal value 20 m3/d is used
- E = emission of fine particles (g/s)
In an assessment, exposure concentration c is solved from the equation and used as exposure in health impact modelling.
Rationale
Inputs and calculations
| Variable | Measure | Indices | Missing data |
|---|---|---|---|
| emissions (from the model) is in ton /a | Required indices: - . Typical indices: Time, City_area, Exposure_agent, Emission_height. | ||
| iF (generic data but depends on population density, emission height etc) | conc (g /m3) * pop (#) * BR (m3 /s) / emis (g /s) <=> conc = emis * iF / BR / pop # conc is the exposure concentration | Required indices: - . Typical indices: Emission_height, Area | |
| population | Amount of population exposed. | Required indices: - . Typical indices: Time, Area |
Data
These data come from [1]
Pollutants:
- PM10-2.5: Primary PM10 - primary PM2.5
- PM2.5: Primary PM2.5
- SO2: Secondary PM2.5 derived from SO2 (in practice, SO_4)
- NOx: Secondary PM2.5 derived from NOx (in practice, NO_3)
- NH3: Secondary PM2.5 derived from NH3 (in practice, NH4)
| Obs | Pollutant | Emission height | Urban | Rural | Remote | Average | Description |
|---|---|---|---|---|---|---|---|
| 1 | PM10-2.5 | High | 8.8 | 0.7 | 0.04 | 5.0 | |
| 2 | PM10-2.5 | Low | 13 | 1.1 | 0.04 | 7.5 | |
| 3 | PM10-2.5 | Ground | 40 | 3.7 | 0.04 | 23 | |
| 4 | PM10-2.5 | Average | 37 | 3.4 | 0.04 | 21 | |
| 5 | PM2.5 | High | 11 | 1.6 | 0.1 | 6.8 | |
| 6 | PM2.5 | Low | 15 | 2.0 | 0.1 | 6.8 | |
| 7 | PM2.5 | Ground | 44 | 3.8 | 0.1 | 25 | |
| 8 | PM2.5 | Average | 26 | 2.6 | 0.1 | 15 | |
| 9 | SO2 | 0.99 | 0.79 | 0.05 | 0.89 | ||
| 10 | NOx | 0.2 | 0.17 | 0.01 | 0.18 | ||
| 11 | NH3 | 1.7 | 1.7 | 0.1 | 1.7 |
Data not used
| Obs | Geographical area | Year | PM type | Source category | Subcategory | Result | Description of sub-category | Specification | Description |
|---|---|---|---|---|---|---|---|---|---|
| 1 | Finland | 2000 | Anthropogenic PM2.5 | Power plants | Large power plants | 0.18-0.37 | Emission from large (>50 MW) power plants (n=117) | mode; min-max | Tainio et al. (2010): 0.28 (0.18-0.37) |
| 2 | Finland | 2000 | Anthropogenic PM2.5 | Power plants | Small power plants | 0.27-0.44 | Emission from small (<50 MW) power plants | mode; min-max | Tainio et al. (2010): 0.34 (0.27-0.44) |
| 3 | Northern Europe | - | Anthropogenic PM2.5 | Power plants | Major power plants | 0.50 | - | mean of all seasons | Tainio et al. (2009) |
| Obs | Soucre | Sector | iF | Description |
|---|---|---|---|---|
| 1 | Electricity plants | Energy production | 1.6 | |
| 2 | CHP Plants | Energy production | 11.0 | |
| 3 | Heat plants | Energy production | 15.0 | |
| 4 | Blast furnaces | Energy production | 8.9 | |
| 5 | Gas works | Energy production | 11.0 | |
| 6 | Oil refineries | Energy production | 8.9 | |
| 7 | Coal transformation | Energy production | 15.0 | |
| 8 | Petrochemical plants | Energy production | 8.9 | |
| 9 | Coke/pat. fuel/BKB plants | Energy production | 6.8 | |
| 10 | Other transformation | Energy production | 8.9 | |
| 11 | Energy industry own use | Energy production | 6.8 | |
| 12 | Iron and steel | Industry | 6.8 | |
| 13 | Chemical and petrochem | Industry | 6.8 | |
| 14 | Non-ferrous metals | Industry | 6.8 | |
| 15 | Non-metallic minerals | Industry | 6.8 | |
| 16 | Transport equipment | Industry | 8.9 | |
| 17 | Machinery | Industry | 8.9 | |
| 18 | Mining and quarrying | Industry | 3.8 | |
| 19 | Food and tobacco | Industry | 6.8 | |
| 20 | Paper, pulp & printing | Industry | 6.8 | |
| 21 | Wood and wood products | Industry | 8.9 | |
| 22 | Construction | Industry | 44.0 | |
| 23 | Textile and leather | Industry | 15.0 | |
| 24 | Non-specified | Industry | 8.9 | |
| 25 | Domestic aviation | Transport | 2.0 | |
| 26 | Road computed from transport data | Transport | 25.0 | |
| 27 | Public transport (busses) | Transport | 44.0 | |
| 28 | Automobile | Transport | 25.0 | |
| 29 | Bicycle | Transport | ||
| 30 | Pedestrian | Transport | ||
| 31 | Freight transport | Transport | 25.0 | |
| 32 | Rail transport | Transport | 25.0 | |
| 33 | Of which person transport | Transport | 25.0 | |
| 34 | Of which freight transport | Transport | 3.8 | |
| 35 | Pipeline transport | Transport | 3.8 | |
| 36 | Domestic navigation | Transport | 3.8 | |
| 37 | Non-specified | Transport | 10.0 | |
| 38 | Residential | Other | 25.0 | |
| 39 | Commercial (& public services) | Other | 25.0 | |
| 40 | Street lighting | Other | ||
| 41 | Public utilities (power, heat, water&waste) | Other | 8.9 | |
| 42 | Agriculture & forestry | Other | 3.8 | |
| 43 | Fishing | Other | 0.1 | |
| 44 | Non-specified | Other | 8.9 |
Calculations for Tainio
See also
- Apte research group: Mapping air pollution with Google Street View Cars [1]
Keywords
References
- ↑ 1.0 1.1 Sebastien Humbert, Julian D. Marshall, Shanna Shaked, Joseph V. Spadaro, Yurika Nishioka, Philipp Preiss, Thomas E. McKone, Arpad Horvath, and Olivier Jolliet. Intake Fraction for Particulate Matter: Recommendations for Life Cycle Impact Assessment (2011). Environmental Science and Technology, 45, 4808-4816.
