ERF of outdoor air pollution
| Moderator:Nobody (see all) Click here to sign up. |
|
|
| Upload data
|
Contents
Question
What is the the quantitative dose-response relationships between outdoor air PM2.5 concentration and mortality due to cardio-pulmonary, lung cancer, and other non-accidental causes (index Cause of death 2)?
Answer
This code gets the ovariable of this page and calculates some basic results.
Rationale
Data
| Obs | Exposure agent | Response | Subgroup | Exposure | ER function | Scaling | Exposure unit | Threshold | ERF | Description |
|---|---|---|---|---|---|---|---|---|---|---|
| 1 | PM2.5 | Natural mortality | Age:30+ | Long-term exposure to outdoor pollutants | RR | None | 10 µg/m3 | 0 | 1.08 | Chen & Hoek, 2020 |
| 2 | PM10 | Annual number of days with bronchitis in children | Age:6-12 a | Long-term exposure to outdoor pollutant | RR | None | 10 µg/m3 | 0 | 1.080 (0.980 – 1.190) | HRAPIE, WHO 2013 |
| 3 | PM10 | Incidence chronic bronchitis in adults | Age:18+ a | Long-term exposure to outdoor pollutant | RR | None | 10 µg/m3 | 0 | 1.117 (1.040 – 1.189) | HRAPIE, WHO 2013 |
| 4 | PM10 | Incidence of asthma symptoms in asthmatic children | Age:5-19 a | Long-term exposure to outdoor pollutant | RR | None | 10 µg/m3 | 0 | 1.028 (1.006 – 1.051) | HRAPIE, WHO 2013 |
| 5 | PM2.5 | Hospitalizations, cardiovascular diseases | Age:all ages | Long-term exposure to outdoor pollutant | RR | None | 10 µg/m3 | 0 | 1.0091 (1.0017 – 1.0166) | HRAPIE, WHO 2013 |
| 6 | PM2.5 | Hospitalizations, respiratory diseases | Age:all ages | Long-term exposure to outdoor pollutant | RR | None | 10 µg/m3 | 0 | 1.0190 (0.9982 – 1.0402) | HRAPIE, WHO 2013 |
| 7 | PM2.5 | Restricted activity days (RADs) (including sick-leave, hospital emergency admission, symptom days per person per year) | Age:all ages | Long-term exposure to outdoor pollutant | RR | None | 10 µg/m3 | 0 | 1.0470 (1.0420 – 1.0530) | HRAPIE, WHO 2013 |
| 8 | PM2.5 | Work days lost per worker per year, working age population | Age:age 20-65 a | Long-term exposure to outdoor pollutant | RR | None | 10 µg/m3 | 0 | 1.0460 (1.0390 – 1.0530) | HRAPIE, WHO 2013 |
| 9 | PM2.5 | Lung cancer | Age:age 30+ a | Long-term exposure to outdoor pollutant | RR | None | 10 µg/m3 | 0 | 1.0900 (1.0400 – 1.1400) | Van der Zee et al., 2016 |
| 10 | PM2.5 | Low birth weight (< 2500 g at term) | Age:0 a | Long-term exposure to outdoor pollutant | RR | None | 10 µg/m3 | 0 | 1.1900 (1.0000 – 1.4200) | Van der Zee et al., 2016 |
| 11 | PM2.5 | Decreased lung function (FEV1) in percentage (per 10 µg/m³) | Age:6-12 a | Long-term exposure to outdoor pollutant | ERS | None | 10 µg/m3 | 0 | 0.015 (-0.003 - 0.032) | Van der Zee et al., 2016 |
| 12 | PM10 | Post-neonatal mortality | Age:1-12 months = age 0 a*11/12 | Long-term exposure to outdoor pollutant | RR | None | 10 µg/m3 | 0 | 1.040 (1.020 – 1.070) | HRAPIE, WHO 2013 |
| 13 | PM10 | YLL (premature deaths) | Age:30+ a | Long-term exposure to outdoor pollutant | RR | None | 10 µg/m3 | 0 | 1.035 (1.004 – 1.066) | Hoek et al., 2013 |
| 14 | PM2.5 | YLL (premature deaths) | Age:30+ a | Long-term exposure to outdoor pollutant | RR | None | 10 µg/m3 | 0 | 1.062 (1.041 – 1.084) | Hoek et al., 2013 |
| 15 | NO2 | YLL (premature deaths) | Age:30+ a | Long-term exposure to outdoor pollutant | RR | None | 10 µg/m3 | 0 | 1.020 (1.010 – 1.030) | Atkinson et al., 2017 |
| 16 | EC | YLL (premature deaths) | Age:30+ a | Long-term exposure to outdoor pollutant | RR | None | µg/m3 | 0 | 1.061 (1.049 – 1.073) | Hoek et al., 2013 Note! per 1 µg/m3 |
| 17 | PM10 | Decline in life expecancy in days | Age:30+ a | Long-term exposure to outdoor pollutant | ERS | None | 10 µg/m3 | 0 | 120 (14 - 223) | Hoek et al., 2013 |
| 18 | PM2.5 | Decline in life expecancy in days | Age:30+ a | Long-term exposure to outdoor pollutant | ERS | None | 10 µg/m3 | 0 | 210 (140 - 281) | Hoek et al., 2013 |
| 19 | NO2 | Decline in life expecancy in days | Age:30+ a | Long-term exposure to outdoor pollutant | ERS | None | 10 µg/m3 | 0 | 69 (35 - 103) | Atkinson et al., 2017 |
| 20 | EC | Decline in life expecancy in days | Age:30+ a | Long-term exposure to outdoor pollutant | ERS | None | µg/m3 | 0 | 206 (167 - 246) | Hoek et al., 2013 Note! per 1 µg/m3 |
| 21 | PM2.5 | Lung cancer mortality | Long-term exposure to outdoor pollutant | RR | None | µg /m3 | 0 | 1.014 (1.004-1.023) | Pope et al. 2002 | |
| 22 | PM2.5 | Cardiopulmonary mortality | Long-term exposure to outdoor pollutant | RR | None | µg /m3 | 0 | 1.009 (1.003-1.016) | Pope et al. 2002 | |
| 23 | PM2.5 | Total mortality | Long-term exposure to outdoor pollutant | RR | None | µg /m3 | 0 | 1.0062 (1.0014-1.011) | Pope? | |
| 24 | Outdoor ozone | Total mortality | Long-term exposure to outdoor pollutant | RR | None | µg /m3 | 0 | 1.000299596 (1.000099955-1.000399282) | ||
| 25 | Outdoor ozone | Mild decreasing on general functioning | Long-term exposure to outdoor pollutant | UR | None | µg /m3 | 0 | 0.115 (0.044-0.186) |
Ozone and PM2.5 used to be on page ERFs of environmental pollutants.
Cutoff values used in PAQ2018 tool[1]: 3.9 µg/m³ for PM10, 2.5 µg/m³ for PM2.5, 5.0 µg/m³ for NO2, 0.3 µg/m³ for EC.
Studies used:
- Chen & Hoek, 2020
- HRAPIE
- WHO 2013
- Van der Zee et al., 2016
- Hoek et al., 2013
- Atkinson et al., 2017
- Dockery et al. 1993
- Pope et al. 2002
Classical literature
Recent literature on global PM2.5 disease burden estimates
- Lelieveld, J., Evans, J., Fnais, M. et al. The contribution of outdoor air pollution sources to premature mortality on a global scale. Nature 525, 367–371 (2015). https://doi.org/10.1038/nature15371
- Richard Burnett, Hong Chen, Mieczysław Szyszkowicz, Neal Fann, Bryan Hubbell, C. Arden Pope III, Joshua S. Apte, Michael Brauer, Aaron Cohen, Scott Weichenthal, Jay Coggins, Qian Di, Bert Brunekreef, Joseph Frostad, Stephen S. Lim, Haidong Kan, Katherine D. Walker, George D. Thurston, Richard B. Hayes, Chris C. Lim, Michelle C. Turner, Michael Jerrett, Daniel Krewski, Susan M. Gapstur, W. Ryan Diver, Bart Ostro, Debbie Goldberg, Daniel L. Crouse, Randall V. Martin, Paul Peters, Lauren Pinault, Michael Tjepkema, Aaron van Donkelaar, Paul J. Villeneuve, Anthony B. Miller, Peng Yin, Maigeng Zhou, Lijun Wang, Nicole A. H. Janssen, Marten Marra, Richard W. Atkinson, Hilda Tsang, Thuan Quoc Thach, John B. Cannon, Ryan T. Allen, Jaime E. Hart, Francine Laden, Giulia Cesaroni, Francesco Forastiere, Gudrun Weinmayr, Andrea Jaensch, Gabriele Nagel, Hans Concin, and Joseph V. Spadaro. Global estimates of mortality associated with long-term exposure to outdoor fine particulate matter. PNAS September 18, 2018 115 (38) 9592-9597; https://doi.org/10.1073/pnas.1803222115
- Karn Vohra, Alina Vodonos, Joel Schwartz, Eloise A.Marais, Melissa P.Sulprizio, Loretta J.Mickley. Global mortality from outdoor fine particle pollution generated by fossil fuel combustion: Results from GEOS-Chem https://doi.org/10.1016/j.envres.2021.110754
- Heli Lehtomäki, Antti Korhonen, Arja Asikainen, Niko Karvosenoja, Kaarle Kupiainen, Ville-Veikko Paunu, Mikko Savolahti, Mikhail Sofiev, Yuliia Palamarchuk, Ari Karppinen, Jaakko Kukkonen and Otto Hänninen. Health Impacts of Ambient Air Pollution in Finland. Int. J. Environ. Res. Public Health 2018, 15(4), 736; https://doi.org/10.3390/ijerph15040736
| average exposure level in Europe to PM2,5 | 25 | μg/m3 annual average |
| average inhalation rate | 15 | #/min |
| average tidal volume | 0.6 | L |
| inhaled air/person*year | 4734 | m3/a |
| average inhaled PM2,5 per year | 0,12 | g/a |
| population of Europe | 515000000 | |
| total PM inhaled by European population | 60945615 | g/a |
| BoD increase from EU-26 population exposure to [BH90] | 1,5E+06 | DALY/a |
| Population CVD BoD increase | 2,5E-02 | DALY/1g PM2,5 intake |
| All-cause mortality increase | 1,04 | RR per 10 μg/m3 PM2,5 increase |
| LC mortality increase | 1,14 | RR per 10 μg/m3 PM2,5 increase |
| CVD mortality increase | 1,09 | RR per 10 μg/m3 PM2,5 increase |
| EU-26 weighed average from Global BoD estimates | Data from:[2] |
⇤--#: . The end of this table contains calculations within the excel it was taken from, it only says #REF, because the frmulas have been broken somehow. --Heta (talk) 07:36, 10 June 2015 (UTC) (type: truth; paradigms: science: attack)
PM2.5 are fine particles less than 2.5 μm in diameter. Exposure-response function can be derived from exposure modelling, animal toxicology, small clinical or panel studies, and epidemiological studies. Exposed population can be divided into subpopulations (e.g. adults, children, infants, the elderly), and exposure is assessed per certain time period (e.g. daily or annual exposure).
- Health effects related to short-term exposure
- respiratory symptoms
- adverse cardiovascular effects
- increased medication usage
- increased number of hospital admissions
- increased mortality
- Health effects related to long-term exposure (more relevance to public health)
- increased incidence of respiratory symptoms
- reduction in lung function
- increased incidence of chronic obstructive pulmonary disease (COPD)
- reduction in life expectancy
- increased cardiopulmonary mortality
- increased lung cancer mortality
Sensitive subgroups: children, the elderly, individuals with heart and lung disease, individuals who are active outdoors.
Mortality effects of long-term (chronic) exposure to ambient air
In principle the ERFs for long-term exposure (produced by cohort studies) should also capture the mortality effects of short-term exposure (ERFs produced by time-series studies). In practice it is likely that they do not do so fully. This is due to the so-called "harvesting" phenomenon, i.e. it is possible that acute exposure, at least to some extent, only brings forward deaths that would have happened shortly in any case. However, adding effects of acute exposure to effects of long-term exposure is problematic because the risk of double-counting. [2]
Pope et al. (2002) [3]
- 6% increase in the risk of deaths from all causes (excluding violent death) (95% CI 2-11%) per 10 µg/m3 PM2.5 in age group 30+
- 12% increase in the risk of death from cardiovascular diseases and diabetes (95% CI 8-15%) per 10 µg/m3 PM2.5 in age group 30+
- 14% increase in the risk of death from lung cancer (95% CI 4-23%) per 10 µg/m3 PM2.5 in age group 30+
Woodruff et al (1997) [4]
- 4% (95% Cl 2%-7%) increase in all-cause infant mortality per 10 µg/m3 PM10 (age 1 month to 1 year)
Tuomisto et al. 2008:[5]
- A structured expert judgement study of the population mortality effects of PM2.5 air pollution.
- Opinions of six European air pollution experts were elicited.
- Percent increase per 1 µg/m3 increase in PM2.5:
- Equal-weight decision-maker
- Best estimate 0.97
- 95% quantile 4.54
- 5% quantile 0.02
- Performance-based decision-maker
- Best estimate 0.60
- 95% quantile 3.80
- 5% quantile 0.06
- Equal-weight decision-maker
'Mortality effects of short-term (acute) exposure to ambient air PM
Anderson et al. 2004 [6]
- 0.6% (95% Cl 0.4%-0.8%) increase in all-cause mortality (excluding accidents) per 10 µg/m3 PM10 in all ages
- 1.3% (95% Cl 0.5%-2%) increase in respiratory mortality per 10 µg/m3 PM10 in all ages
- 0.9% (95% Cl 0.5%-1.3%) increase in cardiovascular mortality per 10 µg/m3 PM10 in all ages
These coefficients are defined as distributions around estimates of central tendency for each cause of death.
Relative increase of mortality per 1 μgm-3 increase of outdoor PM2.5 concentration. Values were drawn with equal probability from the two distributions reported in [7], [8]
Uncertainties:
- Mortality estimate from Hoek et al. (2002)[9] was not included due to many confounding factors related to mortality, e.g. road noise.
- Probability for PM2.5 assumed to be the true cause of the effects in 70 %, 90 %, and 10 % for cardiopulmonary, lung cancer and all other mortality, respectively (author judgement).
- Toxicity differences between ambient air particles and the particles generated by different bus types were not taken into account due to lack of comprehensive data. [10] [11]
Other
- Burnett RT, Pope CA 3rd, Ezzati M, Olives C, Lim SS, Mehta S, Shin HH, Singh G, Hubbell B, Brauer M, Anderson HR, Smith KR, Balmes JR, Bruce NG, Kan H, Laden F, Prüss-Ustün A, Turner MC, Gapstur SM, Diver WR, Cohen A. An integrated risk function for estimating the global burden of disease attributable to ambient fine particulate matter exposure. Environ Health Perspect. 2014 Apr;122(4):397-403. doi:10.1289/ehp.1307049 Epub 2014 Feb 7. Erratum in Environ Health Perspect. 2014 Sep;122(9):A235. [3] [4]
Calculations
Effect of infiltration
The mortality due to indoor exposure to outdoor pollutants can be described with this equation:
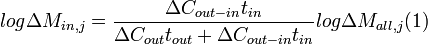
- where logΔMall, j is the increase in mortality due to the jth outcome associated with total PM exposure for each 10 μg/m3 increase in PM10 or PM2.5.
- j represents three major health outcomes: all-cause, cardiovascular, and respiratory mortality.
- ΔCout is the increase in outdoor PM10 or PM2.5 concentrations, which is set as 10 μg/m3.
- ΔCout-in is the increase in outdoor-originated PM10 or PM2.5 concentrations found in the indoor environment.
- tout is the duration of direct exposure to outdoor PM pollution.
- tin is the duration of indoor exposure to PM of outdoor origin.
- logΔMin, j estimates the increase in mortality due to the jth outcome associated with indoor exposure to outdoor-origin PM for each 10 μg/m3 increase in PM10 or PM2.5
When one compares changes in mortality in different countries and different infiltration factors, this is what I think actually happens:
If infiltration factor is relatively low such as for PM10 in China, the people are exposed less than predicted based on outdoor concentrations. When an epidemiologic study is performed, the observed mortality rate is lower than in other places with higher infiltration factors, and this can be falsely interpreted that the dose-response slope (ΔMall) is less steep. When this mortality estimate was combined with the lower exposure estimate (due to low infiltration) in equation 1, you get too low an estimate for the mortality due to indoor exposure to outdoor PM. In contrast, the local infiltration factor could and should be used to adjust the observed mortality rate.
In other words, what you actually observe in epidemiological studies is not ΔMall but ΔMobs, which is something close to ΔMin because so much time is spent indoors. The work should be about estimating ΔMall based on ΔMobs and infiltration and not vice versa. (Here I interpret ΔMall as the true risk estimate that we would observe, if the exposure measure was correct.)
More precisely, let's look at the mathematics of log-linear regression. We assume that the logarithms of the observed probabilities (or rates) of disease have the probability distribution of
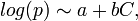
- where p is the probability of disease,
- a is a constant describing the background probability,
- b is a risk coefficient for the exposure, and
- C is the exposure concentration in the population.
What happens with PM is that we observe the differences in the probability of disease due to differences in exposure C. However, we do NOT observe C itself (the actual exposure concentration) but only the surrogate Cobs, which in this case is the outdoor concentration of PM Cout. With a given difference in the probability of disease between the exposed and non-exposed groups, we therefore make a biased conclusion about b, and this bias can be described as:

- where E is the exposed group,
- 0 is the non-exposed group, and
- obs is the biased observed variable (in contrast to the actual variable we would observe if all measurements were correct). Let's look at the ratio of the biased and correct risk estimates:
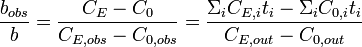
- where i means different microenvironments and ti is the fraction of time spent in each microenvironment. If we use Fi to denote the relative exposure concentrations in different microenvironments i (in the case of only indoor and outdoor microenvironments F is 1 for outdoor and equal to infiltration factor for indoor), we get

As we can see, the observed b is biased downward if the population spends a lot of time in microenvironments with low infiltration factor. Therefore, it is a mistake to assume that the bobs would reflect logΔMall. Instead,
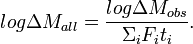
and this should be used in any related calculations.
See also
- Major upgrade was made to this page on 2021-03-19. For previous content (dated 2015), see archive.
- Health aspects of air pollution. Results from the WHO project "Systematic review of health aspects of air pollution in Europe". World Health Organization, 2004.
- Pope et al. 2004. Cardiovascular mortality and long-term exposure to particulate air pollution. Circulation (109), 71-77.
- C. Puett, Joel Schwartz, Jaime E. Hart, Jeff D. Yanosky, Frank E. Speizer, Helen Suh, Christopher J. Paciorek, Lucas M. Neas and Francine Laden: Chronic Particulate Exposure, Mortality, and Coronary Heart Disease in the Nurses’ Health Study. American Journal of Epidemiology, doi:10.1093/aje/kwn232
- NEEDS - New Energy Externalities Developments for Sustainability, Deliverable 3.7 "A set of concentration-response function", Integrated Project, Sixth Framework Programme, Project no. 502687.
References
- ↑ Partnership on Air Quality. (2019). Air Quality Tool. [1]
- ↑ Service Contract for Carrying out Cost-Benefit Analysis of Air Quality Related Issues, in particular in the Clean Air for Europe (CAFE) Programme. Volume 2: Health Impact Assessment. AEA Technology Environment, 2005.
- ↑ *Pope CA III, Burnett RT, Thun MJ, Calle EE, Krewski D, Ito K & Thurston KD (2002). Lung cancer, cardiopulmonary mortality, and long-term exposure to fine particulate air pollution. JAMA 287(9), 1132-1141.
- ↑ Woodruff TJ, Grillo J & Schoendorf KC (1997). The relationship between selected causes of postneonatal infant mortality and particulate air pollution in the United States. Environmental Health Perspectives, 105: 608-612.
- ↑ Tuomisto et al. 2008. Uncertainty in mortality response to airborne fine particulate matter: Combining European air pollution experts. Reliability Engineering and System Safety 93, 732-744.
- ↑ Anderson HR, Atkinson RW, Peacock JL, Marston L & Konstantinou K (2004). Meta-analysis of time-series studies and panel studies of paticulate matter (PM) and ozone (O3). Report of a WHO task group. World Health Organization.
- ↑ Dockery, D. W., Pope, C. A., III, Xu, X., Spengler, J. D., Ware, J. H., Fay, M. E., Ferris, B. G., Jr., & Speizer F. E. (1993). An association between air pollution and mortality in six U.S. cities. The New England Journal of Medicine, 329(24), 1753-1759
- ↑ Pope, C. A. III, Burnett, R. T., Thun, M. J., Calle, E. E., Krewski, D., Ito, K., & Thurston, G. D. (2002). Lung Cancer, Cardiopulmory Mortality, and Long-term Exposure to Fine Particulate Air Pollution. The Journal of the American Medical Association, 287(9), 1132-1141
- ↑ Hoek, G, Brunekreef, B, Goldbohm, S, Fischer, P, & van den Brandt, P. A. (2002). Association between mortality and indicators of traffic-related air pollution in the Netherlands: a cohort study. Lancet, 360 (9341), 1203-1209.
- ↑ Laden, F., Neas, L. M., Dockery, D. W., & Schwartz, J. (2000). Association of fine particulate matter from different sources with daily mortality in six U.S. cities. Environmental Health Perspectives, 108, 941-947.
- ↑ Mar, T. F., Norris, G. A., Koenig, J. Q., & Larson, T. V. (2000). Associations between air pollution and mortality in Phoenix, 1995-1997. Environmental Health Perspectives, 108(4), 347-353.
- ↑ WHO Regional Office for Europe (2003). Health Aspects of Air Pollution with Particulate Matter, Ozone and Nitrogen Dioxide, Report on a WHO Working Group. Report on a WHO working group, Bonn, Germany, January 13-15 2003. Copenhagen. 98 pages. Available at http://www.euro.who.int/eprise/main/who/progs/aiq/newsevents/20030115_2
- ↑ Schwartz, J., Laden, F., & Zanobetti, A. (2002). The concentration-response relation between PM2.5 and daily deaths. Environmental Health Perspectives, 110(10), 1025-1029.
